TL;DR
Most CRO bid defence decks open with credentials and country counts. The evidence points to a different job for the deck. In Industry Standard Research (ISR) work from 2013, cost sat well below therapeutic expertise and project management as a selection driver, yet it was the most common reason sponsors gave for ruling a CRO out: price can lose a bid but rarely wins one. The enrolment statistic many feasibility slides still repeat, that one in five sites never enrols a patient, is folklore; Tufts CSDD measured 11% across more than 150 trials, found that 37% of sites under-enrol, and found that reaching enrolment goals typically took nearly double the planned timeline (data from 2008–2010 trials, published 2013). Since ICH E6(R3) took effect in the EU on 23 July 2025, sponsors are also expected to document risk-proportionate oversight of every service provider, which hands your governance slide a regulatory template. Build the deck around those three exposures, and expect to be interrupted.
Clinical trials that meet enrolment goals (Tufts CSDD; 150+ trials, ~16,000 sites; trials run 2008–2010; published 2013; dated)
Typical planned-versus-actual timeline when those goals are met (Tufts CSDD, same study; dated)
Sites that enrol zero patients (Tufts CSDD), against the 20% rule of thumb still quoted (dated)
Sites that under-enrol (Tufts CSDD; dated)
Large / mid-size / small sponsors using preferred provider agreements (ISR, Clinical Leader, June 2024)
CROs who believed price was a fundamental sponsor selection measure (Applied Clinical Trials survey article)
ICH E6(R3) effective date in the EU (Step 4 adopted 6 January 2025)
CRO services market, 2026 to 2031, 8.6% CAGR (MarketsandMarkets); other estimates run from about $48B to $100B depending on scope
1. The sponsor is buying down risk, and cost can only subtract
By the time a CRO reaches the bid defence meeting, it has already passed RFP scoring. Finalists are invited to defend their proposals in front of the sponsor's cross-functional team. The deck is therefore not an introduction. It is the place where the sponsor tests whether the proposal's assumptions survive questions.
The selection research is consistent on what sponsors weigh, and consistent on a trap. ISR's 2013 analysis of sponsor behaviour found that cost 'invariably' sat well down the list of stated selection drivers, behind therapeutic expertise, quality project managers and prior relationships. When ISR asked sponsors what rules a CRO out, however, high cost was the leading answer by a substantial margin. ISR's conclusion was that cost is unlikely to win a bid but can certainly lose one. A separate survey article reported that more than a third of CROs (38%) believed price was a fundamental selection measure for sponsors, while sponsors were far more likely than CROs to stress the project management team. CROs, on this evidence, over-model price and under-model the people who will run the study.
This evidence is dated. The ISR cost analysis is from 2013, and the survey article carries no publication year in the copy we could retrieve. ISR's more recent benchmarking (Phase II/III CRO study, reported June 2024) confirms that therapeutic expertise is valued whichever decision scenario applies, and that preferred provider agreements are used by 88% of large sponsors, 54% of mid-size sponsors and 16% of small sponsors. The 2024 data narrows the audience: at a large sponsor, you may be defending against an incumbent, not competing on a blank sheet.
The practical consequence is a change in the deck's opening. Credentials earn a place on the invitation, not in the first five minutes. The first slide should name the execution risks of this protocol, as the sponsor would list them, and state how the CRO has priced and staffed against each.
2. Feasibility slides should show where sites fail, not how many countries you cover
The country count is the most common feasibility visual and the least informative. A map with 18 shaded countries tells the sponsor where a CRO has a presence. It says nothing about how many of those sites will enrol.
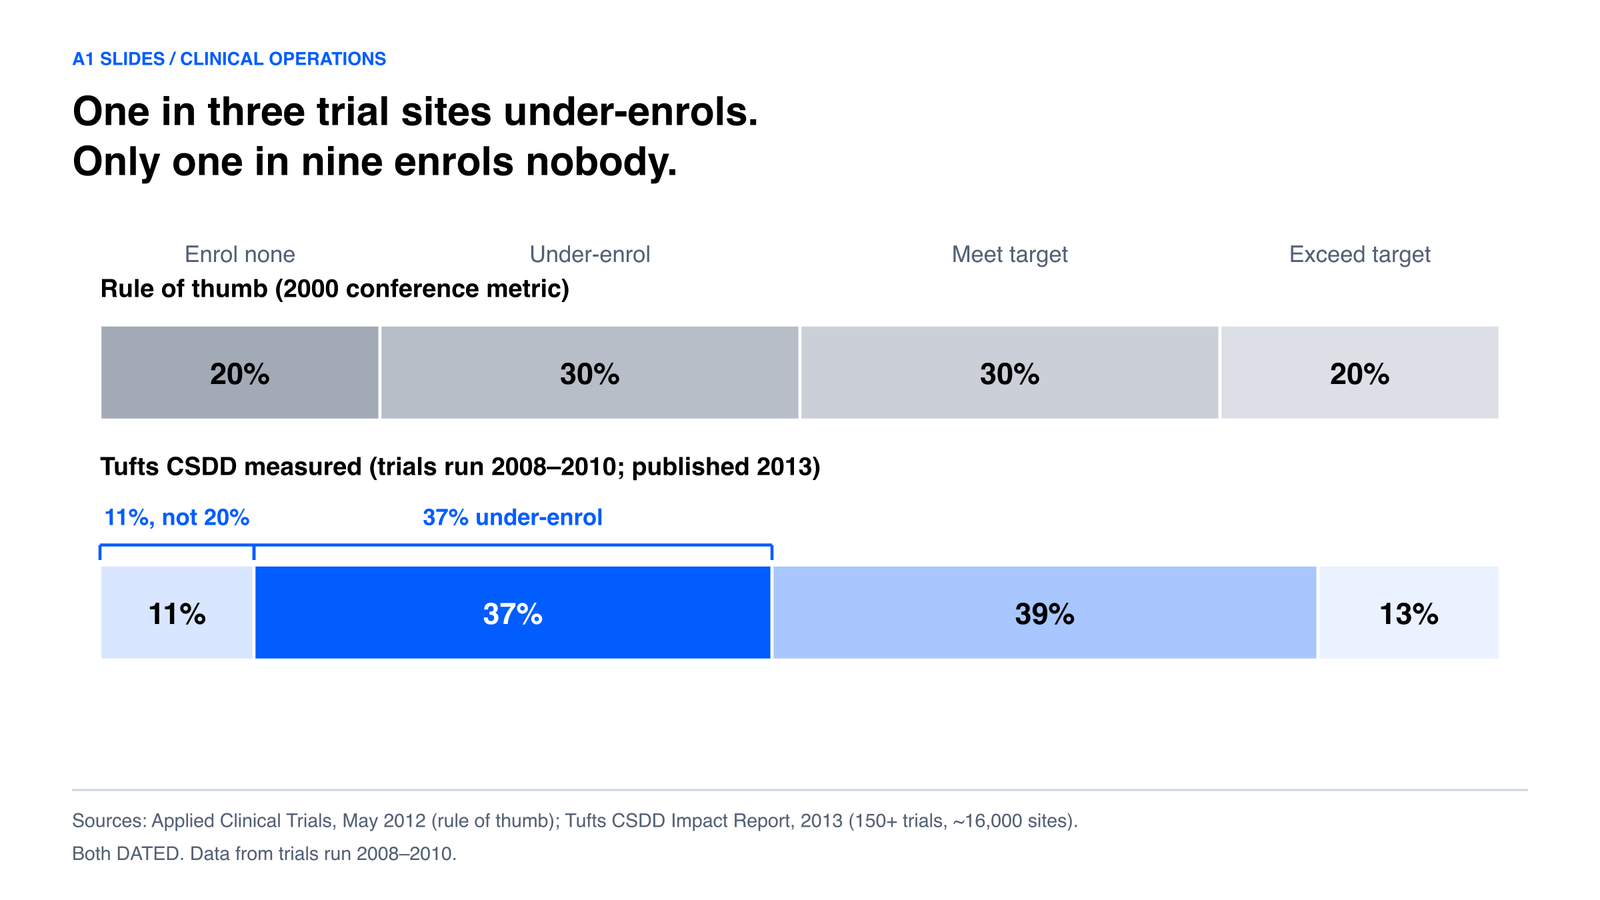
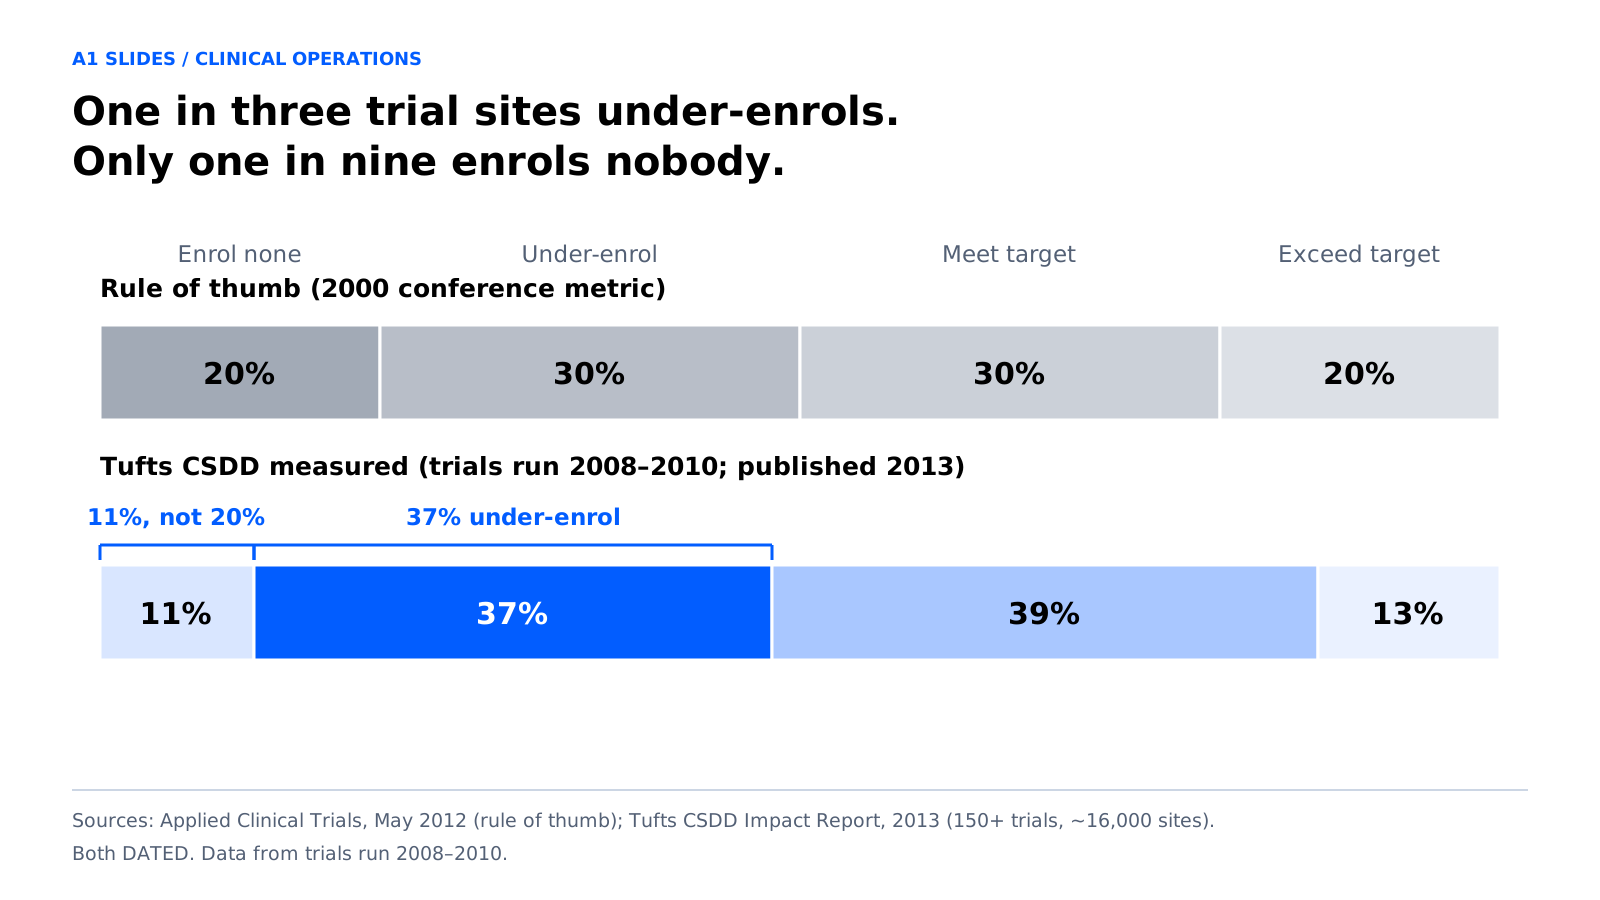
The benchmark most decks reach for is also wrong. A metric presented at a small conference in 2000, based on interviews with clinical operations managers, held that 20% of investigative sites fail to enrol a single patient, 30% under-enrol, 30% meet target and 20% exceed it. It became a widely cited fact. When Tufts CSDD measured performance directly, using data from 10 pharmaceutical companies and two CROs covering nearly 16,000 sites in 151 trials run in 2008–2010, the distribution was different: 11% enrolled none, 37% under-enrolled, 39% met target and 13% exceeded it.
Table 1 sets the two side by side.
Table 1. Site enrolment performance: the rule of thumb versus the Tufts CSDD measurement (both dated)
| Site outcome | Rule of thumb (2000 conference metric) | Tufts CSDD measured (2008–2010 trials, published 2013) |
|---|---|---|
| Enrol no patient | 20% | 11% |
| Under-enrol | 30% | 37% |
| Meet target | 30% | 39% |
| Exceed target | 20% | 13% |
Both columns sum to 100%.
The corrected picture changes what a feasibility slide should argue. Zero-enrolling sites are a smaller problem than the folklore implies. Under-enrolment is a larger one: more than a third of sites in a typical trial fall short. A bid defence slide that promises 'no dormant sites' is answering the wrong question. The credible slide shows a site-level funnel for this protocol (identified, selected, activated, enrolling, at target), states the assumed share at each stage, and says what the CRO will do about the under-enrolling band. Where the CRO's own past studies show where selected sites stalled, that history is stronger evidence than any benchmark.
The Tufts data is dated. We have not located a later Tufts CSDD update that replaces it, and the dated label should stay on the slide: 'Tufts CSDD, 2008–2010 trials'.
For design treatment of funnel and distribution charts, see our guide to clinical data visualisation.
3. The timeline slide has to admit slip
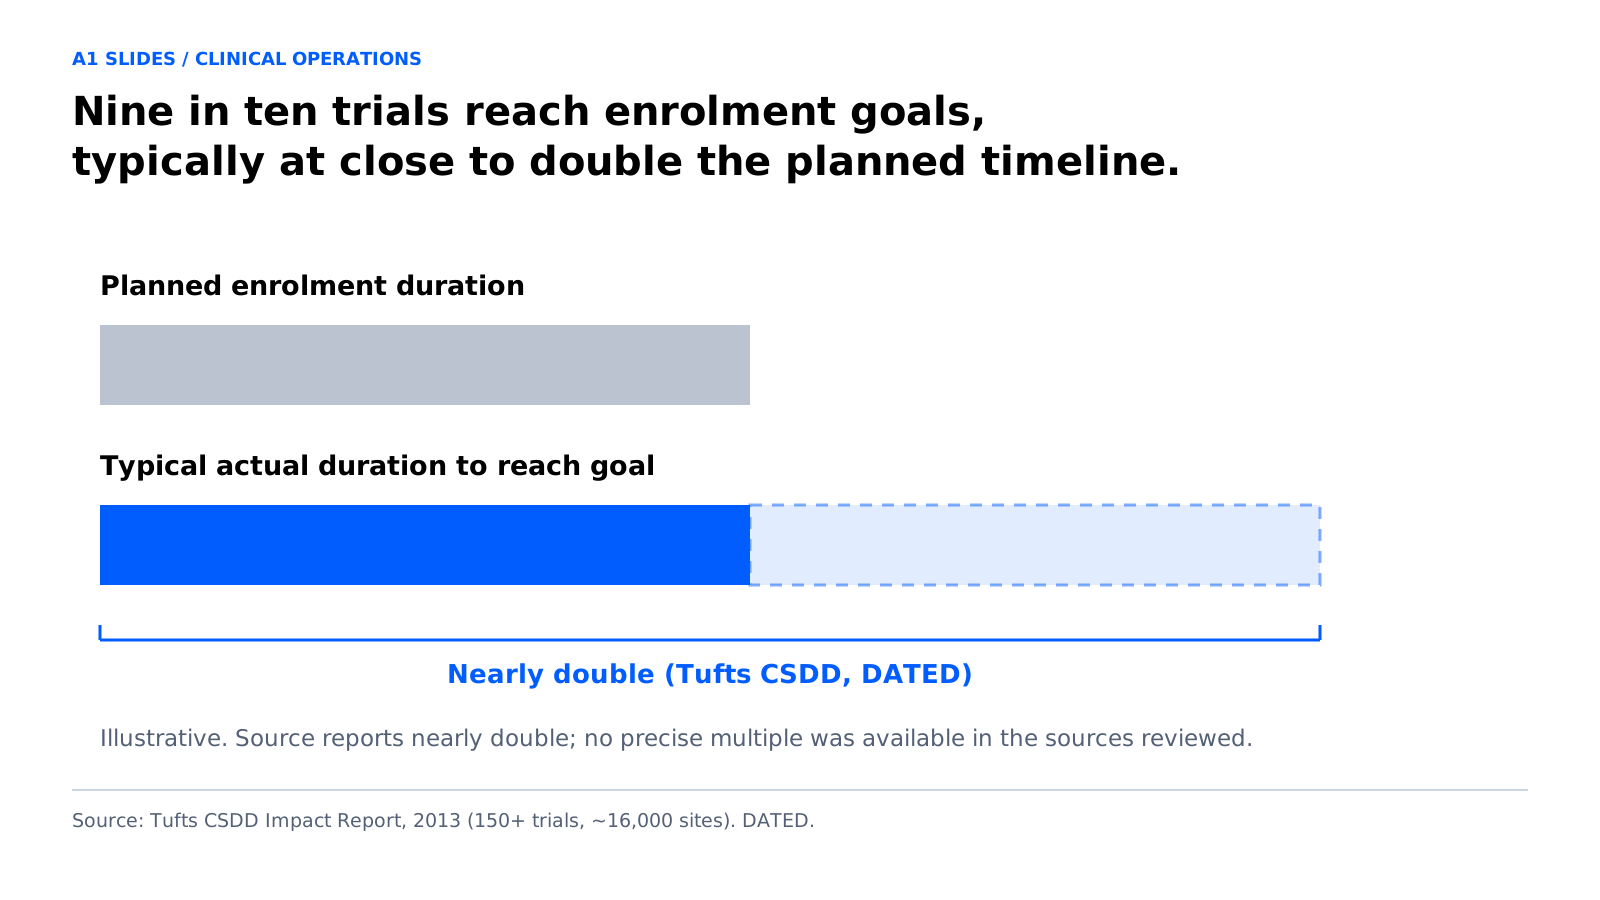
The headline Tufts finding is easy to misread. Nine in ten trials, 89%, meet their enrolment goals. But Tufts reported that reaching those goals typically meant nearly doubling the original timeline. An earlier CenterWatch study of several hundred sites reported that upwards of 90% of trials miss the timeline set in the study contract.
Both findings are dated, and CenterWatch's was sample-based rather than a census of trials. The direction is still clear enough to shape a slide. A single Gantt bar with a hard enrolment-complete date invites the sponsor's operations lead to ask what happens when it slips, and the CRO that has no answer on the page loses ground in the room.
The stronger treatment is a scenario band: planned, expected and stress-case enrolment completion, with the assumptions that separate them (screen-failure rate, site activation lag, competing studies). This does two things. It shows the sponsor that the CRO has priced against slip rather than against the optimistic case, and it turns a later change-order conversation into one already framed on the page. For structuring the argument before the data is final, the ghost deck method applies directly.
4. Oversight slides now have a regulatory template
The governance slide is usually an org chart. It should be a map of obligations.
Under 21 CFR 312.52, a sponsor may transfer any or all obligations to a CRO, but the transfer must be described in writing, and any obligation not covered by the written description is deemed not transferred. A CRO that assumes an obligation is subject to the same regulatory action as a sponsor for failing to meet it. That makes the scope-of-delegation slide a regulatory matter, not a courtesy. 'Full service' on a slide is not a description of obligations.
ICH E6(R3) sharpened the sponsor's side of the relationship. It reached ICH Step 4 on 6 January 2025, took effect in the EU on 23 July 2025, and FDA issued its own final guidance on 8 September 2025. The guideline now refers to 'service providers' rather than CROs, reflecting a wider set of organisations carrying out specific trial activities, and explicitly requires service providers to report to the sponsor any incident that could affect participants' rights or the reliability of trial results. Oversight, in R3, is a design decision: the sponsor is expected to define and document the basis for oversight in proportion to risk, not merely confirm that a contract exists. WCG's summary identifies a new sponsor-oversight section (3.9) and a provision on oversight of activities that are transferred and then subcontracted (3.6.10).
Table 2 translates those requirements into slide decisions. It is the part of this page that a competitor cannot copy without doing the same reading.
Table 2. From regulatory requirement to bid defence slide
| Requirement | Source | What the slide should do |
|---|---|---|
| Transfer of obligations described in writing; anything undescribed is not transferred | 21 CFR 312.52(a) | List each obligation the CRO assumes and each the sponsor retains. Replace 'full service' with an itemised split. |
| CRO subject to same regulatory action as sponsor for assumed obligations | 21 CFR 312.52(b) | Name an accountable owner for each assumed obligation. |
| Sponsor oversight defined and documented in proportion to risk | ICH E6(R3), new sponsor-oversight section (3.9) | Show the critical-to-quality factors for this protocol and the oversight intensity the CRO proposes for each. |
| Oversight of activities subcontracted onward | ICH E6(R3) (3.6.10) | Map every subcontractor, the activity it carries, and who at the CRO oversees it. |
| Service providers report incidents affecting participants' rights or data reliability to the sponsor | ICH E6(R3) | Show the escalation path: who reports, to whom, and how the sponsor sees it. |
| Contracts define ownership, access and retention of essential records; sponsors need their own systems (eTMF, CTMS) to show continuous oversight | ICH E6(R3), as read by Veeva (vendor source) | Show which systems the sponsor can access, and when. Treat the vendor reading as a lead, not a citation, until checked against the text. |
| Training of sponsor, site, CRO and other provider personnel | ICH E6(R3), as read by Veeva (vendor source) | Include the training basis for the proposed team. |
5. Delegation and subcontractor scope belongs on a slide, not in the contract appendix
Sponsors who have read R3 will ask a question that predates it: who is actually doing this work? A CRO that answers in the room, from memory, has conceded the point. The same information on a slide, with named organisations, activities and oversight owners, makes the CRO look like the party that has already thought about the sponsor's inspection exposure.
The design discipline matters here. A subcontractor map is a dense object, and it belongs in the same visual family as the oversight table: one row per activity, columns for provider, scope, and the CRO owner. Leave out logos and keep columns aligned. A subcontractor slide designed to look reassuring and not to be read is the one that gets questions.
6. The team slide must prove the people in the room will run the study
The recurring complaint about bid defences is not about the deck. Laurie Halloran, writing in 2017, noted growing sponsor concern about the disconnect between the CRO's business development group and the clinical operations team that takes over after the meeting; some sponsors had dropped bid defences, and others were replacing them with workshops. The article is paywalled, so only its opening is verified. A later industry guide says most observers still consider a well-executed bid defence valuable. Both are dated and secondary; both point the same way.
If the recurring failure is a hand-off, the team slide should address it directly. Show the named project lead, clinical lead and data lead who will run the study, their overlap with the people presenting, and what portion of the proposed hours each person carries. That is more persuasive than a headshot grid. Sponsors weigh the project management team heavily, and the team slide is where the CRO shows the team is real.
7. Build the deck to be interrupted
A bid defence is, in the words of one sponsor-side guide, part presentation and mostly a forum for discussion, serving as a microcosm of how the partnership would work. That has an architectural consequence. A deck written to be presented straight through, at a fixed pace, breaks the first time the sponsor stops it.
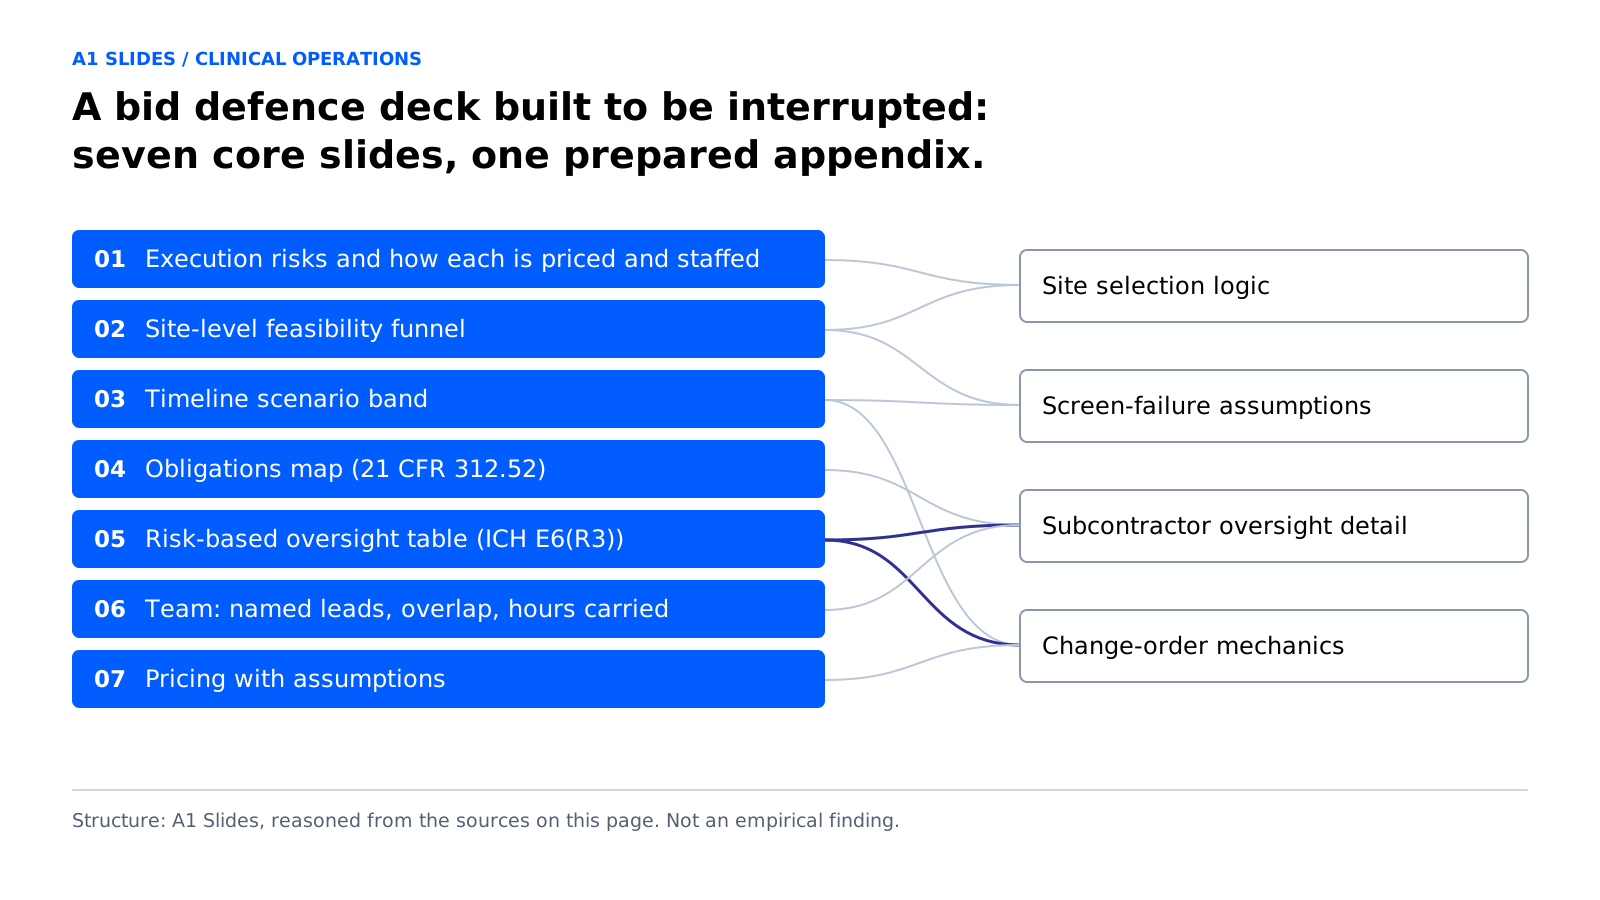
The architecture that survives interruption has two layers. The first is a short core path: the risk framing slide, the site-level feasibility funnel, the timeline scenario band, the obligations map, the oversight table, the team slide, and a pricing slide that exposes the assumptions behind the number. The second is a prepared appendix of backup slides keyed to the questions each core slide is likely to draw: site selection logic, screen-failure assumptions, subcontractor oversight detail, change-order mechanics.
On the pricing slide, the evidence in section 1 is the reason to show assumptions and not only totals. If cost can lose a bid, the number must read as the consequence of the feasibility and staffing assumptions already on the page, not as an isolated figure.
Table 3 sets out the treatments that tend to fail beside the ones that hold up.
Table 3. Common treatments versus treatments that hold up under questioning
| Slide | Common treatment | Treatment that holds up |
|---|---|---|
| Opening | Credentials, awards, global footprint | The protocol's execution risks, with how each is priced and staffed |
| Feasibility | Map with country count | Site-level funnel with stage-by-stage assumptions |
| Benchmark | '20% of sites never enrol' | Dated, attributed distribution (Tufts CSDD 11 / 37 / 39 / 13) |
| Timeline | One enrolment-complete date | Planned, expected and stress-case band |
| Governance | Org chart | Obligations map plus risk-based oversight table |
| Subcontractors | Logo wall | Activity-by-provider table with named CRO owners |
| Team | Headshot grid | Named study leads, overlap with presenters, hours carried |
| Pricing | Total and discount | Total plus the assumptions that drive it |
For a wider treatment of sponsor-facing deck design in pharma, see our guide to pharmaceutical presentation design.
8. What the evidence does not tell us
Three gaps should be stated plainly, because a page that claims more than the evidence supports would not survive the audience it is written for.
First, we found no primary data on whether slide design changes selection outcomes. The argument that these treatments help is a synthesis of selection research, enrolment benchmarking and regulation. It is a reasoned position, not a measured effect.
Second, we found no published win-rate data for bid defences. The trade guides describe the meeting; none quantify it.
Third, the benchmarks that carry this page are old. Tufts CSDD's enrolment distribution comes from trials run in 2008–2010. ISR's cost analysis is from 2013. We have not located newer figures that replace either, and the 2024 ISR benchmarking available publicly describes selection criteria and preferred provider use but not the non-award reasons. Where this page uses older figures, it labels them as such, and a sponsor reading it should treat them as the best available evidence, not current measurement.
On market size: the oft-quoted CRO market figures are scope-dependent. MarketsandMarkets projects $93.02 billion in 2026 and $140.32 billion by 2031 at an 8.6% CAGR, while other estimates range from roughly $48 billion for pharmaceutical CRO work only to about $100 billion for the full services market. The number is context for a CRO's own marketing. It has no place in a bid defence deck.
Preparing a bid defence deck on a short clock? Send us one section (the feasibility funnel, the oversight table or the timeline scenario band) through the 3-Slide Challenge. Briefs in by 6pm, three slides back by 8am
Start the 3-Slide ChallengeFAQ
A formal presentation and Q&A in which shortlisted CROs defend their proposals before the sponsor's cross-functional evaluation team. In a typical sponsor workflow it follows RFP scoring: finalists are invited, scored, and the top CRO is then asked for a final scope and detailed budget.
Same meeting. 'Defence' is UK usage and 'defense' is US usage.
Rarely, on the evidence available. ISR's 2013 analysis found cost well down the list of selection drivers behind therapeutic expertise, quality project managers and prior relationships, but high cost was the leading reason sponsors gave for ruling a CRO out. That finding is dated; ISR's 2024 benchmarking confirms therapeutic expertise is valued in every decision scenario.
Tufts CSDD measured 11% across more than 150 trials and nearly 16,000 sites (trials run 2008–2010, published 2013), not the 20% often repeated. It also found 37% of sites under-enrolled. These figures are dated.
As a site-level funnel for the specific protocol (identified, selected, activated, enrolling, at target) with the assumed share at each stage, not a country map. The Tufts distribution of 11% none, 37% under, 39% on target and 13% over is the dated benchmark to attribute if a benchmark is shown.
Tufts CSDD found 89% do, but typically by nearly doubling the original timeline. A timeline slide should show a planned, expected and stress-case band, not a single date.
Any transfer of sponsor obligations to a CRO must be described in writing; an obligation not covered by the writing is deemed not transferred. A CRO that assumes an obligation is subject to the same regulatory action as a sponsor for failing to comply with it.
The guideline reached Step 4 on 6 January 2025 and took effect in the EU on 23 July 2025. It refers to 'service providers' rather than CROs, expects sponsor oversight to be defined and documented in proportion to risk, and requires service providers to report to the sponsor any incident that could affect participants' rights or the reliability of trial results.
The people who will run the study. Halloran's 2017 commentary pointed to a disconnect between business development and the operations team after the meeting, and sponsors weigh the project management team heavily. A team slide with named leads and hours carried addresses it directly.
Some were, as of 2017: Halloran reported sponsors eliminating them or substituting workshops. A later industry guide says most observers still value a well-executed bid defence. Both sources are dated and secondary.
One industry guide cites often 80–120 man-hours, attributing the figure to Reelay.
MarketsandMarkets projects $93.02 billion in 2026 and $140.32 billion by 2031 at 8.6% CAGR. Other estimates range from roughly $48 billion to $100 billion depending on scope. Sponsors are evaluating one study; the market figure adds nothing to a bid defence deck.

References
18 sources- Industry Standard Research. 'Influence of Cost in the CRO Selection Process.' Applied Clinical Trials, 1 March 2013 (dated). appliedclinicaltrialsonline.com
- Industry Standard Research. 'Getting A Grasp On CRO Selection.' Clinical Leader, 25 June 2024 (Phase II/III CRO Benchmarking study, 16th year). clinicalleader.com
- 'Key Factors in CRO Selection.' Applied Clinical Trials. appliedclinicaltrialsonline.com
- Tufts Center for the Study of Drug Development. Impact Report findings on patient recruitment and retention, as reported by FierceBiotech, 2013 (analysis of 150+ trials, ~16,000 sites; dated). fiercebiotech.com
- 'Enrollment Performance: Weighing the Facts.' Applied Clinical Trials, May 2012 (dated). appliedclinicaltrialsonline.com
- Cytel. 'Patient Recruitment Feasibility: Would you bet $12 million dollars on it?' (summary of the Tufts CSDD 2012 data request: 10 pharmaceutical companies, two CROs, 151 trials, 2008–2010). cytel.com
- 21 CFR 312.52, Transfer of obligations to a contract research organization. law.cornell.edu (check against eCFR before publication)
- Sidley. 'International Council Finalizes Modernized Global Good Clinical Practice Guideline.' February 2025. sidley.com
- CASRAI. 'Sponsor Oversight of Delegated CRO Functions Under ICH E6(R3)' and 'ICH E6(R3): What Changed in Good Clinical Practice' (secondary; used for FDA 8 September 2025 date and oversight framing; replace with ICH and FDA primary documents). casrai.org and casrai.org
- WCG. 'ICH E6 (R3) Countdown' FAQ (section references 3.9, 3.6.10; secondary). wcgclinical.com
- Veeva. 'ICH GCP E6(R3): Implications on Fully Outsourced Sponsors and Studies' (vendor source). veeva.com
- IntuitionLabs. 'Bid Defense Meetings: A Guide to Winning CRO Contracts.' intuitionlabs.ai
- Clinical Trials Arena. 'Understanding Bid Defenses in Clinical Trials' (adapted from Don Kellerman, Zosano Pharma). clinicaltrialsarena.com
- Halloran, L. 'How to get the most out of a CRO's bid defense.' The Pharma Letter, 21 September 2017 (DATED; paywalled, only the opening verified). thepharmaletter.com
- SCORR Marketing. 'A Winning Proposal: Your Checklist.' scorrmarketing.com
- MarketsandMarkets. Contract Research Organization (CRO) Services Market press release (2026–2031 forecast). marketsandmarkets.com
- Collective Minds. 'Contract Research Organization Statistics and Trends for 2026' (aggregator; scope range of estimates; replace with primary reports before publication). collectiveminds.health
- ShareVault / NeoTrials. 'Contract Research Organization Checklist' (example sponsor selection workflow including bid defence). new.sharevault.com