TL;DR
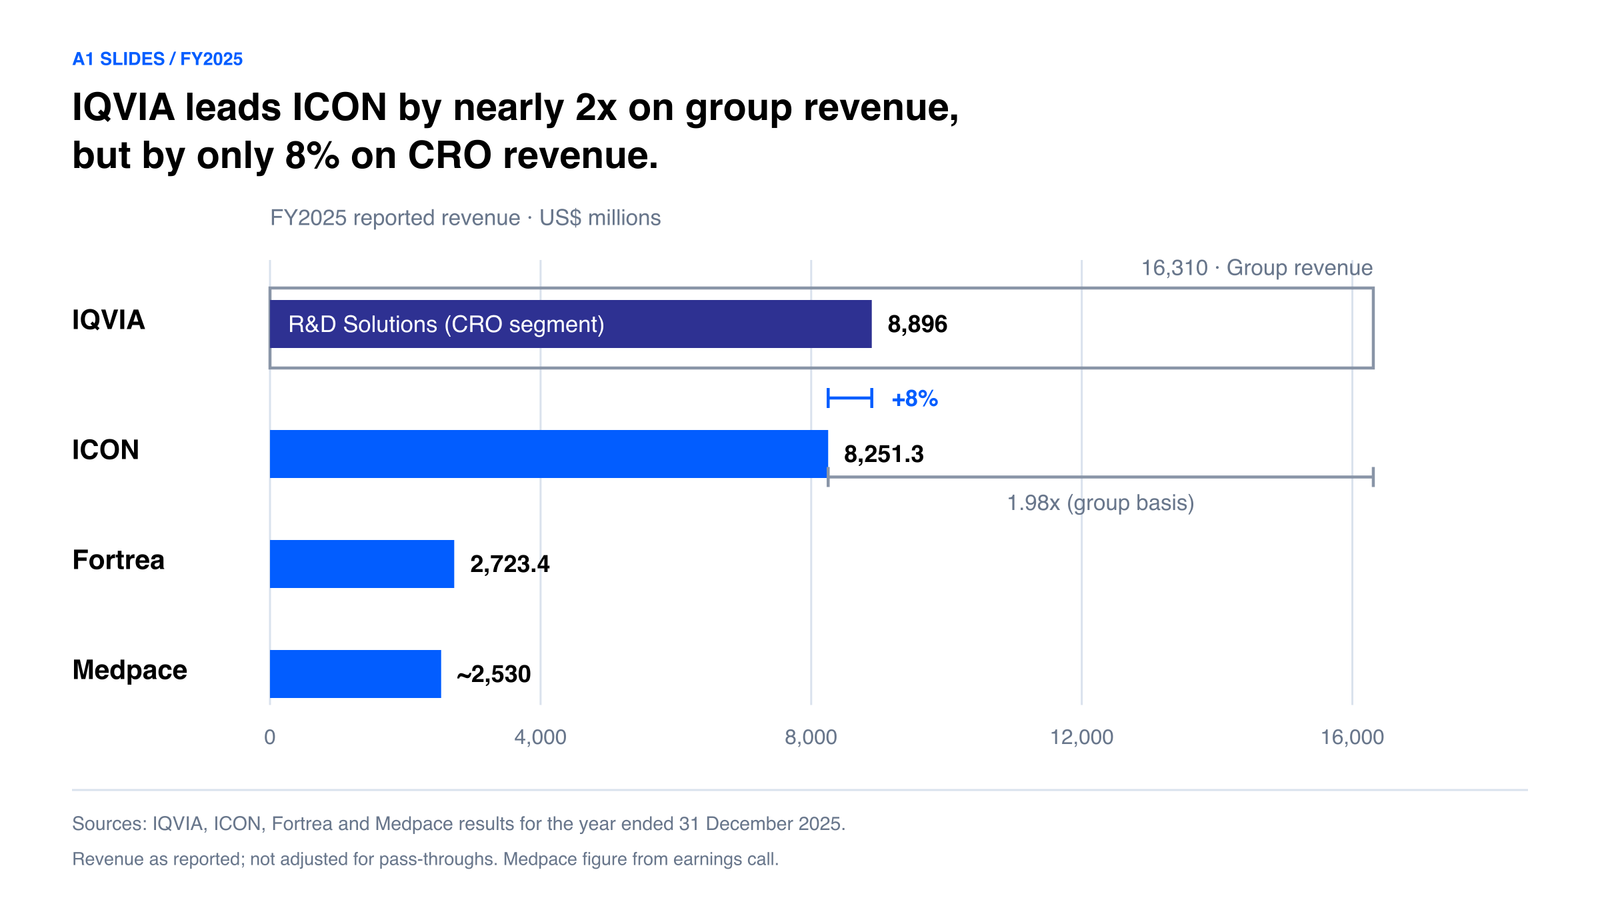
Most 'top CRO' lists rank on estimated or modelled revenue and quietly mix incomparable definitions. Ranked only on revenue the companies themselves reported for FY2025, four of the names usually called the largest can be placed in order: IQVIA, ICON, Fortrea and Medpace. The others (Thermo Fisher's PPD business, Syneos Health, Parexel, and Labcorp's drug development business) are private, sit inside a larger reported segment, or are not clinical-development CROs on the reported numbers, so they appear unranked, with the reason stated. The ranking also depends on the definition. IQVIA's group revenue of $16,310 million is nearly double ICON's $8,251 million, but IQVIA's R&D Solutions segment, the like-for-like CRO business, leads ICON by about 8%. For each ranked CRO we also set out what a sponsor-facing bid defence deck from a company of that profile would have to prove.
Medpace revenue, FY2025 (+20%) (earnings call)
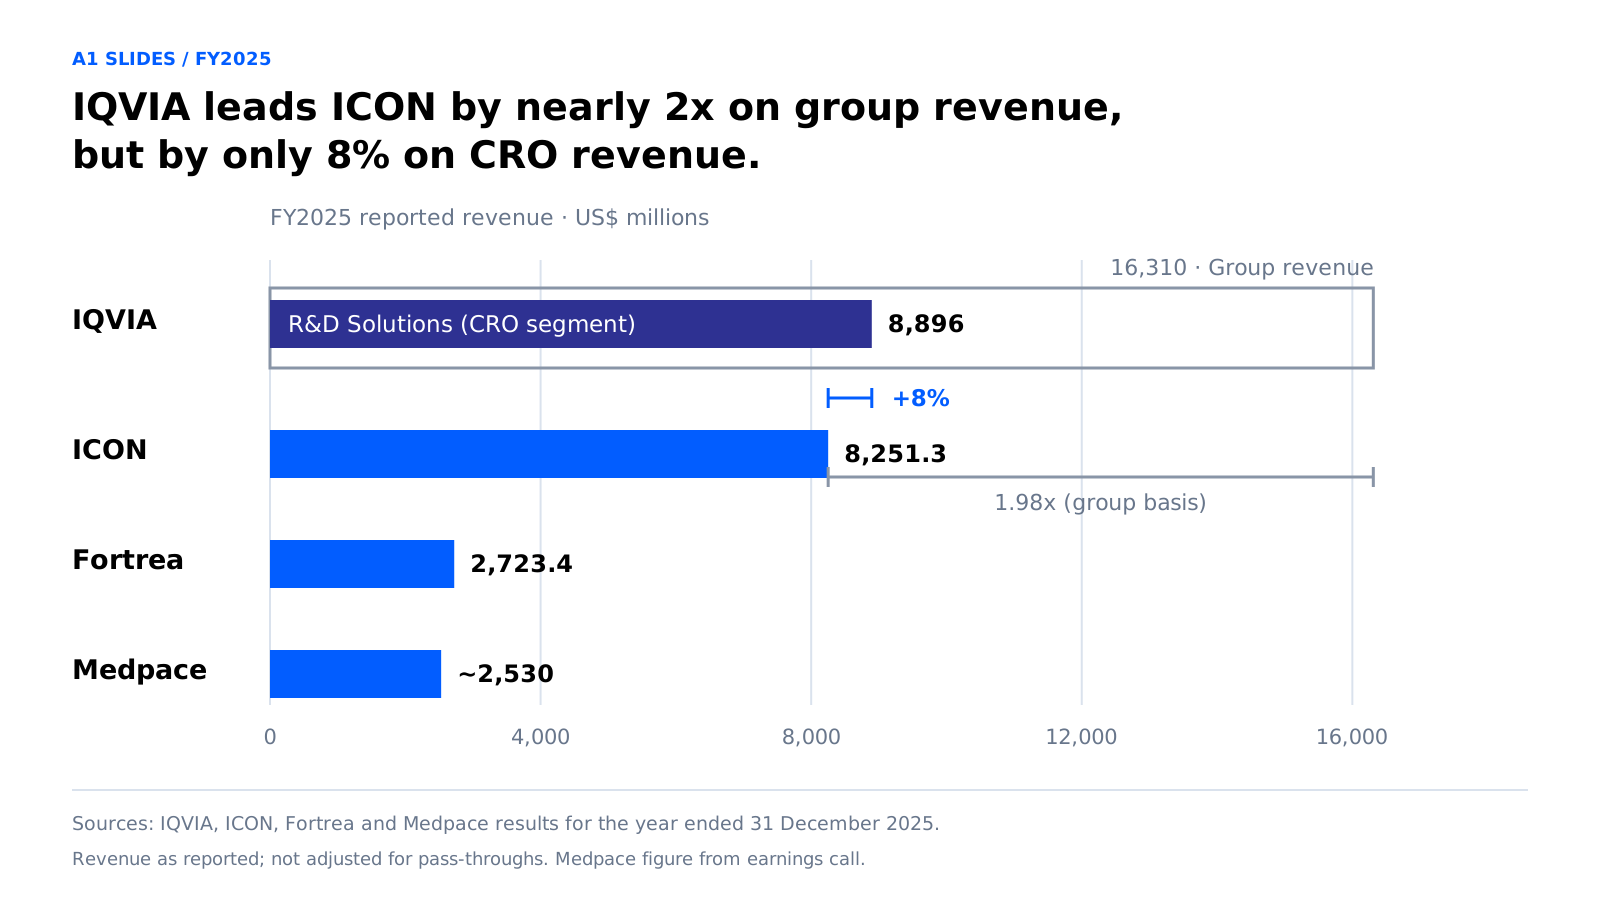
IQVIA R&D Solutions lead over ICON at segment level, against a near-2x gap at group level (derived from reported revenue)
IQVIA R&D Solutions contracted backlog at 31 December 2025 (+5.3%) (IQVIA)
Large CRO names that can be ranked on reported, comparable revenue (this page's method)
CRO market size estimates for 2026 depending on scope (MarketsandMarkets; Grand View via aggregator)
1. The ranking uses reported revenue only, and says what it leaves out
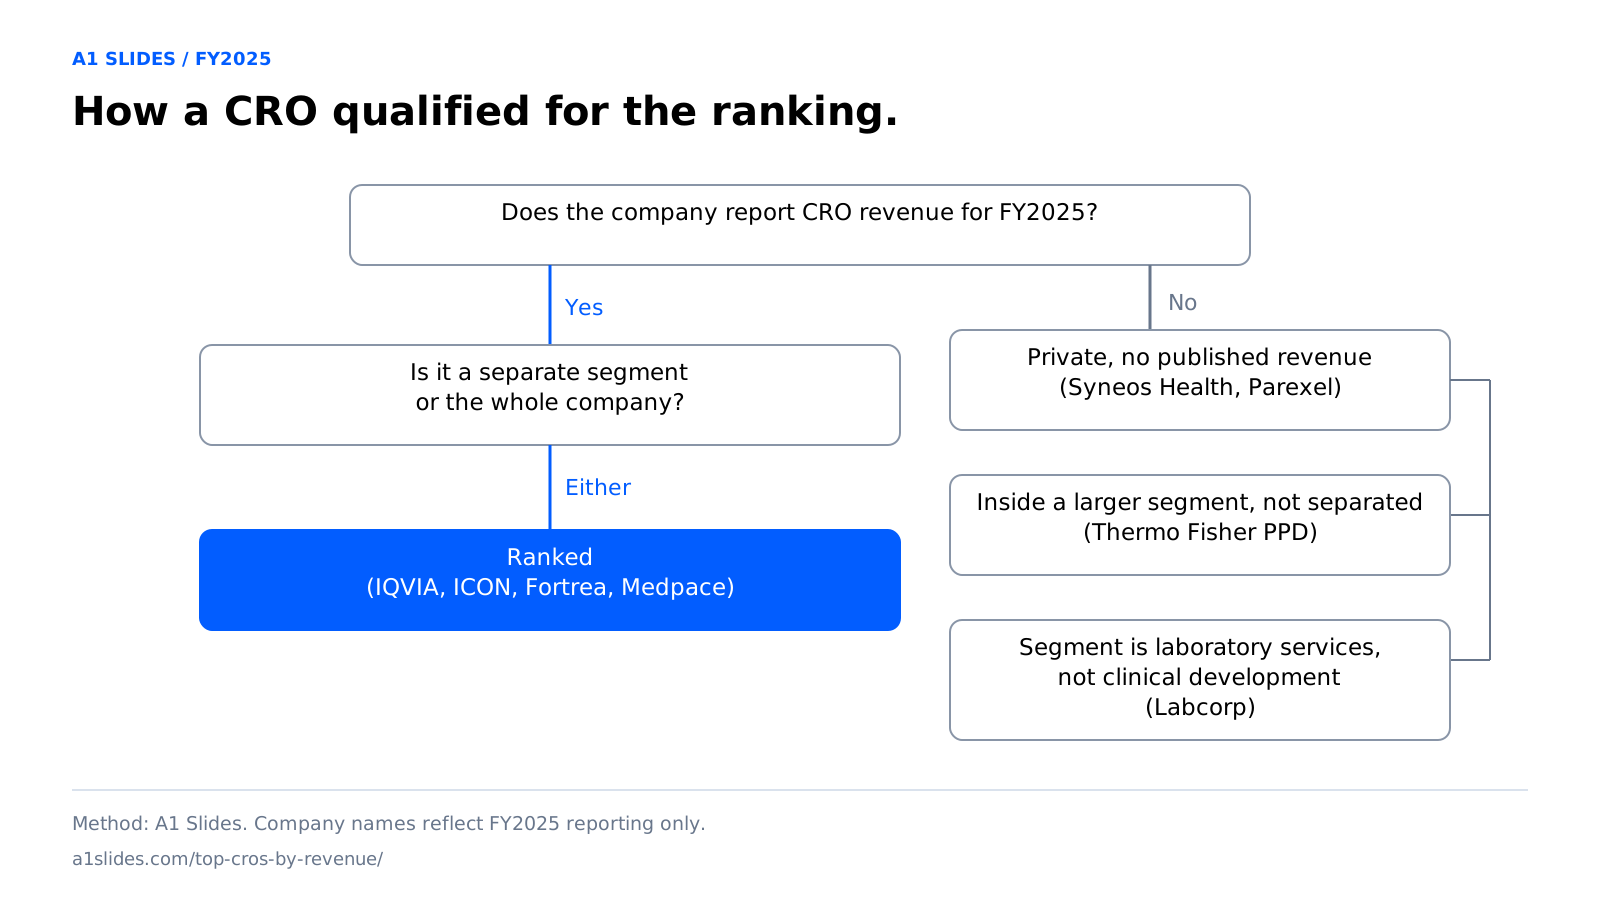
A ranking is only as good as its rule. This one has a single criterion: the revenue each company reported for its clinical research business in its results for the year ended 31 December 2025, taken from the company's own release or filing. Nothing is estimated, modelled or taken from a market-research database.
Five rules keep the comparison honest.
First, where a CRO sits inside a larger group, the ranking uses the reported CRO segment if one is disclosed. IQVIA's R&D Solutions segment is used, not IQVIA's group revenue, which includes its technology and analytics business.
Second, where a company does not disclose its CRO revenue separately, it is listed unranked. Thermo Fisher's PPD business is the example.
Third, private companies are unranked unless they publish revenue. Syneos Health and Parexel are private.
Fourth, revenue is shown as reported. Several CROs include pass-through or reimbursable amounts in reported revenue, and definitions differ. We have not adjusted anything.
Fifth, the ranking says nothing about quality. Revenue is a measure of scale. The selection research we cover below (dated) shows sponsors choosing on therapeutic expertise, project management and prior relationships, not size.
The 'deck test' under each entry is separate from the ranking. It is our analysis of what a sponsor would probe, given the company's disclosed profile, in a bid defence. It is not a claim about any company's actual materials.
2. The ranking changes with the definition: IQVIA leads ICON by 2x or by 8%
Table 1 ranks the four CROs that can be placed on reported, comparable revenue.
Table 1. Top CROs by reported FY2025 revenue (clinical research business)
| Rank | CRO | FY2025 revenue (reported) | Basis | Change vs FY2024 |
|---|---|---|---|---|
| 1 | IQVIA | $8,896M | R&D Solutions segment (group: $16,310M) | +4.3% |
| 2 | ICON | $8,251.3M | Company revenue | +0.8% |
| 3 | Fortrea | $2,723.4M | Company revenue | +1.0% |
| 4 | Medpace | ~$2.53B | Company revenue | ~+20% |
Year-on-year change for Fortrea computed from $2,723.4M against $2,696.4M. Medpace figures are from the company's earnings call, consistent with its reported EBITDA of $557.7M at 22.0% of revenue.
The first and second places show why the definition matters. At group level, IQVIA's $16,310 million is just under double ICON's revenue. At the level of the CRO business itself, IQVIA's R&D Solutions revenue of $8,896 million is about 8% above ICON's $8,251.3 million. A list that ranks on group revenue shows a gap of about 98% between the two. The like-for-like gap is about 8%. Both are the largest clinical research businesses on reported numbers, and the gap between them is far smaller than a group-revenue list implies.
IQVIA changed its segment reporting for 2026. The comparison here uses the FY2025 segments as reported. Next year's version of this page will need to restate IQVIA on the new basis.
Data as of: FY2025 (year ended 31 December 2025), results released February–May 2026.
3. IQVIA: the largest CRO business, at about half the size its group revenue implies
FY2025: R&D Solutions revenue $8,896 million, up 4.3%. Group revenue $16,310 million, up 5.9%. R&D Solutions contracted backlog $32.7 billion, up 5.3%. Quarterly book-to-bill 1.18x. FY2026 group revenue guidance $17,150–17,350 million.
IQVIA's size is the point and the exposure. A backlog of $32.7 billion means a sponsor choosing IQVIA is choosing a delivery system as much as a team.
Deck test. At this scale, the question a sponsor tests is whether the people in the room are the people who will run the study. Halloran's 2017 commentary described sponsor concern about the hand-off from business development to operations (dated, secondary; see our bid defence guide). A deck from a CRO of this size has to name the study leads, show how long they stay, and map oversight across any regional or subcontracted units. The E6(R3) expectation of documented, risk-proportionate oversight of service providers applies to the CRO's own subcontractors as well.
4. ICON: second by revenue, with a restatement a sponsor will read
FY2025: revenue $8,251.3 million, up 0.8% (0.1% constant currency). Adjusted EBITDA $1,530.7 million, 18.6% of revenue. Net business wins $9,033 million; net book-to-bill 1.09. FY2026 revenue guidance $7,850–8,150 million.
The company reported the outcome of an Audit Committee investigation alongside its FY2025 results. It concluded that improper adjustments were made to clinical trial services revenue from the third quarter of 2023 to the fourth quarter of 2024, affecting the timing of revenue recognition. It restated its financials, concluding that revenue was overstated by $65.3 million in 2023 (0.8%) and $92.7 million in 2024 (1.1%). These are the company's own statements.
One discrepancy for the reviewer: a third-party summary of ICON's earnings call quotes full-year revenue of $7.6 billion, against the $8,251 million in the company's release. The difference is probably a revenue definition (for example, excluding pass-throughs).
Deck test. A sponsor that has read the restatement will ask how study-level reporting reaches them and how it is controlled. The deck's oversight slide has to show what the sponsor can see, from which systems, and when. That is the same obligations-and-oversight map we set out as the regulatory template for the oversight slide, built on 21 CFR 312.52 and ICH E6(R3).
5. Fortrea: third by revenue, with the thinnest margin for error on team stability
FY2025: revenue $2,723.4 million, against $2,696.4 million in FY2024. GAAP net loss $986.2 million. Adjusted EBITDA $189.9 million. Fourth-quarter book-to-bill 1.14x; trailing twelve months 1.02x. Full-year cost savings exceeded the company's previous targets.
A summary of the company's earnings call reports that management cited continued headwinds in its functional service provider (FSP) work, variability in pass-through revenue, and customer concentration, with the top ten customers at 56.8% of 2025 revenue (secondary source).
Deck test. Cost savings and lower headcount are facts a sponsor will connect to team continuity. The team slide has to answer directly: named leads, their tenure on the proposed study, and hours carried. Sponsors weigh the project management team heavily in CRO selection (survey article), so the slide carries more weight here than it would for a CRO with a stable headcount story.
6. Medpace: fourth by revenue and first by growth
FY2025: revenue about $2.53 billion, up about 20%. Fourth-quarter revenue $708.5 million, up 32.0%. Net new business awards $2.65 billion for the year (up 18.7%). EBITDA $557.7 million, 22.0% of revenue. Top five and top ten customers about 25% and 35% of revenue.
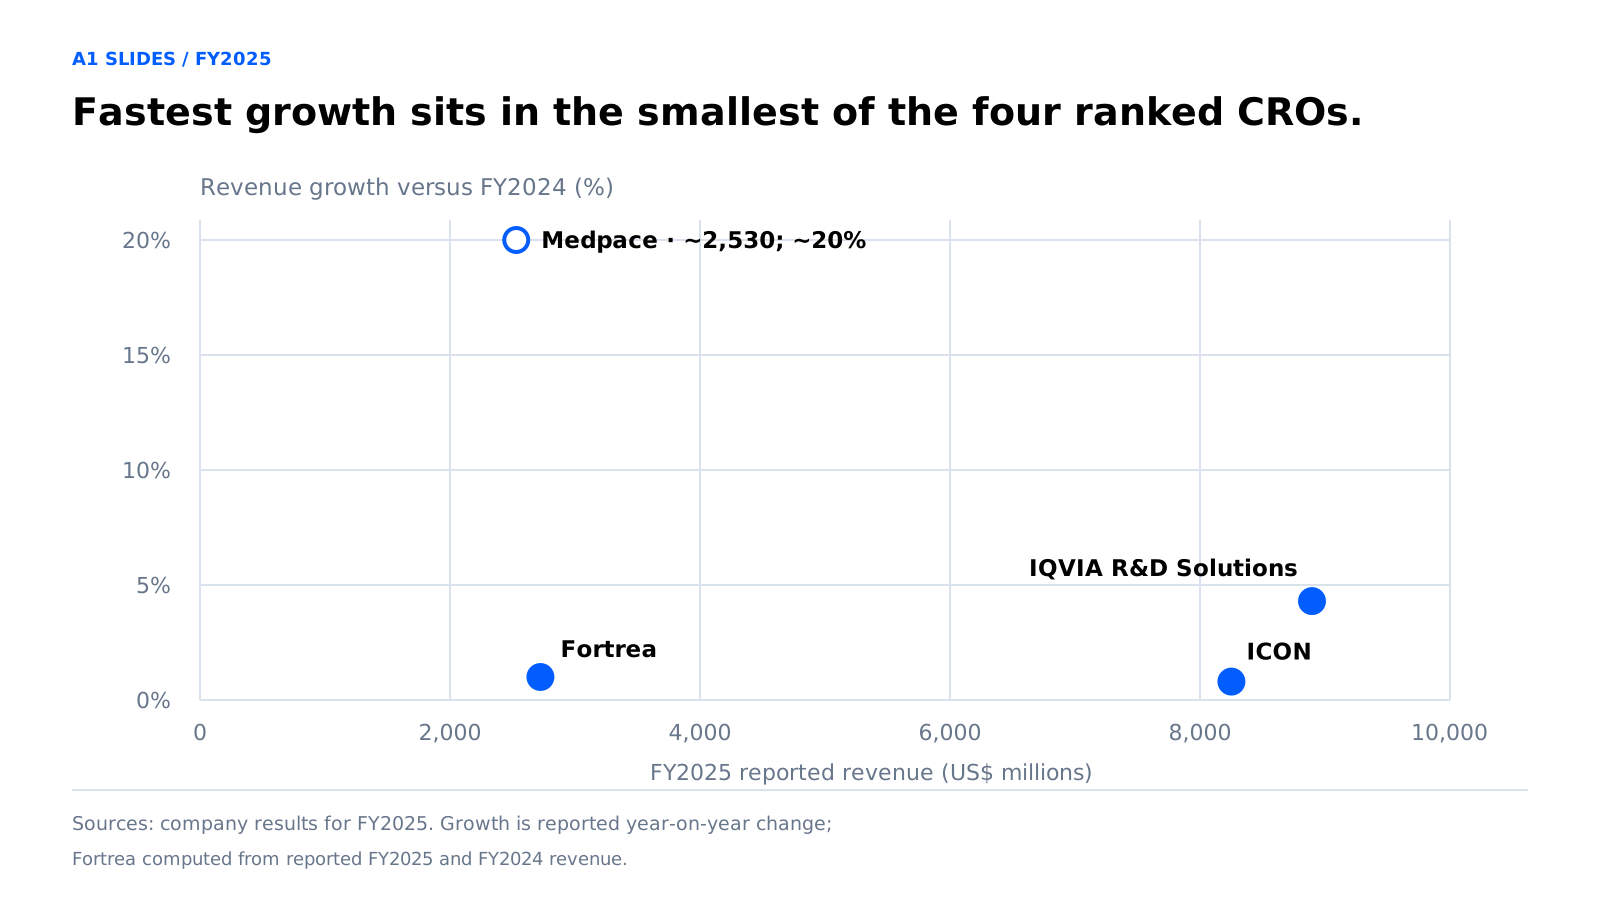
Medpace ranks fourth by a narrow margin to Fortrea and is growing at around twenty times Fortrea's rate on these figures. Whether it passes Fortrea next year depends on conversion of backlog.
Deck test. Fast growth puts the timeline slide under strain. A sponsor will ask whether the team that wins the study has capacity to run it. The scenario band (planned, expected, stress-case enrolment completion) and the named-team slide are the places a fast-growing CRO shows it has priced and staffed against slip. Tufts CSDD found that reaching enrolment goals typically took nearly double the original timeline (data from 2008–2010 trials, published 2013; dated).
7. Four large names are unranked, and the reason is part of the finding
Table 2 lists the names that are usually in top-CRO lists and cannot be placed on reported, comparable revenue.
Table 2. Large CRO names that cannot be ranked on reported, comparable revenue
| Company | Why unranked | What the sources show |
|---|---|---|
| Thermo Fisher (PPD) | Clinical research revenue not separately disclosed in the segment table reviewed | The relevant segment, Laboratory Products and Biopharma Services, reported $23,984M for 2025, including a pharma services business that grew $457M year on year; PPD is not broken out |
| Syneos Health | Private | Taken private in September 2023 by an investment consortium in a deal reported at US$7 billion; no revenue published in the sources reviewed (secondary) |
| Parexel | Private | Acquired by EQT and Goldman Sachs at the end of 2021 for a reported $8.5 billion; no revenue published in the sources reviewed (secondary) |
| Labcorp (drug development) | Reported segment is laboratory services, not clinical development | Biopharma Laboratory Services (central labs and early development) has 2026 guidance of about $3.10 billion; clinical development was spun off as Fortrea in 2023. |
Several market-research directories assign revenue figures to private CROs and to PPD. Those figures are estimates, and some conflict with reported numbers for the public companies. We have not used them.
8. What a sponsor tests every one of these CROs on
The deck tests above are variations on three exposures that apply to any CRO in a bid defence: where sites fail, how timelines slip, and whether oversight of delegated work is documented.
Tufts CSDD's measurement of site performance (data from 10 pharmaceutical companies and two CROs, 151 trials, 2008–2010; dated) found 11% of sites enrolled no patient, 37% under-enrolled, 39% met target and 13% exceeded it. That is a different picture from the 20/30/30/20 rule of thumb still repeated. Under 21 CFR 312.52, any obligation a sponsor transfers to a CRO must be described in writing, and a CRO that assumes an obligation faces the same regulatory action as a sponsor for failing to meet it. ICH E6(R3), in effect in the EU since 23 July 2025, expects sponsor oversight of service providers to be documented in proportion to risk.
The full treatment, with the framework-to-slide table and the chart specifications, is in our CRO bid defence guide.
9. What a revenue ranking does not tell you
Revenue measures scale. It does not measure whether a CRO will win a particular study, deliver it on time, or suit a particular sponsor.
The selection research points the other way. In ISR's 2013 analysis, cost sat well down the list of stated selection drivers, behind therapeutic expertise, quality project managers and prior relationships, yet high cost was the leading reason sponsors gave for ruling a CRO out. ISR's 2024 benchmarking confirms that therapeutic expertise is valued in every decision scenario, and that preferred provider agreements are used by 88% of large sponsors, 54% of mid-size sponsors and 16% of small sponsors. A smaller CRO with the right therapeutic depth can beat a larger one. The 2013 evidence is dated and we have not located a replacement.
On market size, the commonly cited numbers depend on scope. MarketsandMarkets projects $93.02 billion in 2026 rising to $140.32 billion by 2031 at 8.6% CAGR. Other estimates run from about $48 billion for pharmaceutical CRO work only to roughly $100 billion for the full services market. Our ranking is bounded by what companies report, which is a smaller and more checkable claim.
Pitching a sponsor against the names on this list? Send us one section of your bid defence deck (the feasibility funnel, the oversight table or the timeline scenario band) through the 3-Slide Challenge. Briefs in by 6pm, three slides back by 8am
Start the 3-Slide ChallengeFAQ
On reported FY2025 numbers, IQVIA: its R&D Solutions segment reported $8,896 million, up 4.3%, within group revenue of $16,310 million.
Not on the figures reported. ICON's FY2025 revenue was $8,251.3 million against IQVIA's R&D Solutions revenue of $8,896 million, a gap of about 8%. Group revenue makes IQVIA look almost twice as large, but that includes its technology and analytics business.
Both are private, and the sources reviewed publish no revenue for either. Syneos Health was taken private in September 2023 and Parexel was acquired by EQT and Goldman Sachs at the end of 2021.
Thermo Fisher does not break out clinical research revenue in the segment table reviewed. PPD sits inside its Laboratory Products and Biopharma Services segment, which reported $23,984 million for 2025.
Revenue as each company reports it. Several CROs include pass-through or reimbursable amounts, and definitions differ, so we have not adjusted figures.
Following an Audit Committee investigation, ICON concluded that revenue was overstated by $65.3 million for 2023 (0.8% of total revenue) and $92.7 million for 2024 (1.1%), and restated its financials. It reported FY2025 revenue of $8,251.3 million.
Medpace, at about 20% revenue growth in 2025, against 4.3% for IQVIA R&D Solutions, 1.0% for Fortrea and 0.8% for ICON. The Medpace figure comes from its earnings call and needs verifying against its filings.
It depends on scope. MarketsandMarkets projects $93.02 billion in 2026 and $140.32 billion by 2031 (8.6% CAGR). Other estimates run from about $48 billion to roughly $100 billion.
Revenue does not measure selection. ISR's 2013 analysis found cost well down the list of selection drivers behind therapeutic expertise, quality project managers and prior relationships, though high cost was the leading reason for ruling a CRO out. That finding is dated; ISR's 2024 work confirms therapeutic expertise is valued in every scenario.
FY2025 is the latest complete fiscal year with reported results. Company guidance for 2026 is not reported revenue, so it is not used for ranking.
Around three exposures: where sites fail, how timelines slip, and whether oversight of delegated work is documented under 21 CFR 312.52 and ICH E6(R3). Our CRO bid defence guide sets out the slide-by-slide treatment.

References
18 sources- ICON plc. 'ICON Reports Fourth Quarter and Full Year 2025 Results and Provides Outcome of Audit Committee Investigation.' 27 May 2026. investor.iconplc.com
- Fortrea. 'Fortrea Reports Fourth Quarter and Full-Year 2025 Results; Issues Full-Year 2026 Guidance.' 26 February 2026. investors.fortrea.com
- Medpace Holdings. Form 8-K, results for the fourth quarter and full year ended 31 December 2025. 9 February 2026. sec.gov
- Medpace Q4 2025 earnings call transcript (secondary; source of the full-year revenue figure and customer concentration). pro.stockalarm.io
- Thermo Fisher Scientific. Form 10-K for fiscal year 2025. sec.gov
- Labcorp. 'Labcorp Announces 2025 Fourth Quarter and Full Year Results.' ir.labcorp.com
- Proclinical. 'Top 10 CROs to watch in 2025' (secondary; source for the Syneos take-private and Parexel acquisition). proclinical.com
- MarketBeat. Fortrea Q4 2025 earnings call summary (secondary; customer concentration and FSP headwinds). marketbeat.com
- MarketsandMarkets. Contract Research Organization (CRO) Services Market press release. marketsandmarkets.com
- Collective Minds. 'Contract Research Organization Statistics and Trends for 2026' (aggregator; scope range of estimates; replace with primary reports). collectiveminds.health
- Industry Standard Research. 'Influence of Cost in the CRO Selection Process.' Applied Clinical Trials, 1 March 2013 (dated). appliedclinicaltrialsonline.com
- Industry Standard Research. 'Getting A Grasp On CRO Selection.' Clinical Leader, 25 June 2024. clinicalleader.com
- Nature / Foleon. 'Contract Research Organizations (CROs)' (secondary; Labcorp CRO spin-off and Fortrea independence, 2023). nature.foleon.com
- Tufts Center for the Study of Drug Development, as reported by FierceBiotech, 2013 (dated). fiercebiotech.com
- Cytel. Summary of the Tufts CSDD 2012 data request (10 pharmaceutical companies, two CROs, 151 trials, 2008–2010). cytel.com
- 21 CFR 312.52. law.cornell.edu
- Sidley. 'International Council Finalizes Modernized Global Good Clinical Practice Guideline.' February 2025. sidley.com