Stop wasting billable hours on formatting. Send us your drafts by 6 PM; receive client-ready decks by 8 AM.
In the consulting business, your inventory is time. Stop letting your senior engagement managers burn hours at 3 AM moving text boxes. A1 Slides provides the secure, 24-hour visual infrastructure that keeps your strategy moving while your team sleeps.
The Pain Point

The Opportunity Cost
You have the logic worked out, but the deck looks like a draft. Every hour you spend formatting is an hour lost on refining the recommendation.

The Perception Risk
Clients don't pay for slides; they pay for clarity. A messy deck suggests messy thinking. If the visuals are unpolished, the strategy feels "cheap."
"The expectation: every slide must justify its existence by advancing understanding or enabling decision-making."
— The Enterprise Presentation Outlook
SME Perspective: Strategic Communication in Consulting
Consulting decks should make the recommendation feel inevitable. That means the financial logic, stakeholder implications, and trade-offs have to be visible in the storyline before the deck reaches production.
— Alina Aron, Principal, M&A and Fundraising Strategy, A1 Slides
The 24-Hour "Relay" Workflow
We have engineered our operations to solve the Turnaround Time (TAT) crisis that breaks standard agency partnerships.
6:00 PM (Your Time)
Upload your "Back-of-the-Napkin" sketches, whiteboard photos, or messy clinical data to our secure portal or Share point
Overnight
Our global design team takes over. We don't just "pretty up" slides; we architect the logic, apply your firm’s brand governance, and visualize the "So What?"
8:00 AM (Your Time)
A fully structured, high-fidelity "Ghost Deck" is in your inbox—ready for the steering committee or the partner review.
Specialized Survey Data PowerPoint Formatting & Visualization
We speak the language of the Big 3 and Tier-1 boutiques. We don't need "SmartArt"; we need your logic.
The "Minto" Standard
We build decks on the Pyramid Principle (Situation-Complication-Resolution).
MECE Frameworks
We understand that a SWOT or Value Chain is an analytical tool, not just a drawing.
Bid Defense & Orals
We build the high-impact visuals that differentiate your firm during the "Orals" stage, justifying your premium fees.
Market Research Reporting: Visualization & Formatting at Scale
We transform complex, high-volume survey outputs into clear, executive-ready insights for global research firms. We specialize in visualizing:
Cross-Tabulation Analysis
Precision formatting of dense data grids, ensuring statistical significance (p-values) and key differences are instantly legible.
Segmentation & Regression Trees
Converting abstract statistical models into intuitive visual narratives that illuminate customer segments and decision drivers.
Open-Ended Text Visualization
Moving beyond simple word clouds to architect thematic clustering and qualitative sentiment maps.
Brand & Ad Trackers
Managing consistent, high-accuracy monthly and quarterly reporting cycles for global longitudinal studies.
Built for the Rigor of Global Strategy
Zero-Failure TAT
We understand that "9 AM" means 9 AM. Our global infrastructure is built for 100% on-time delivery.
Enterprise-Grade Security
We routinely handle M&A targets, pre-IPO data, and restructuring plans. Every engagement is NDA-first and data-isolated.
Scalable Capacity
From a 5-slide urgent update to a 300-slide monthly reporting cycle, we scale our "Shadow Shift" to match your engagement volume.
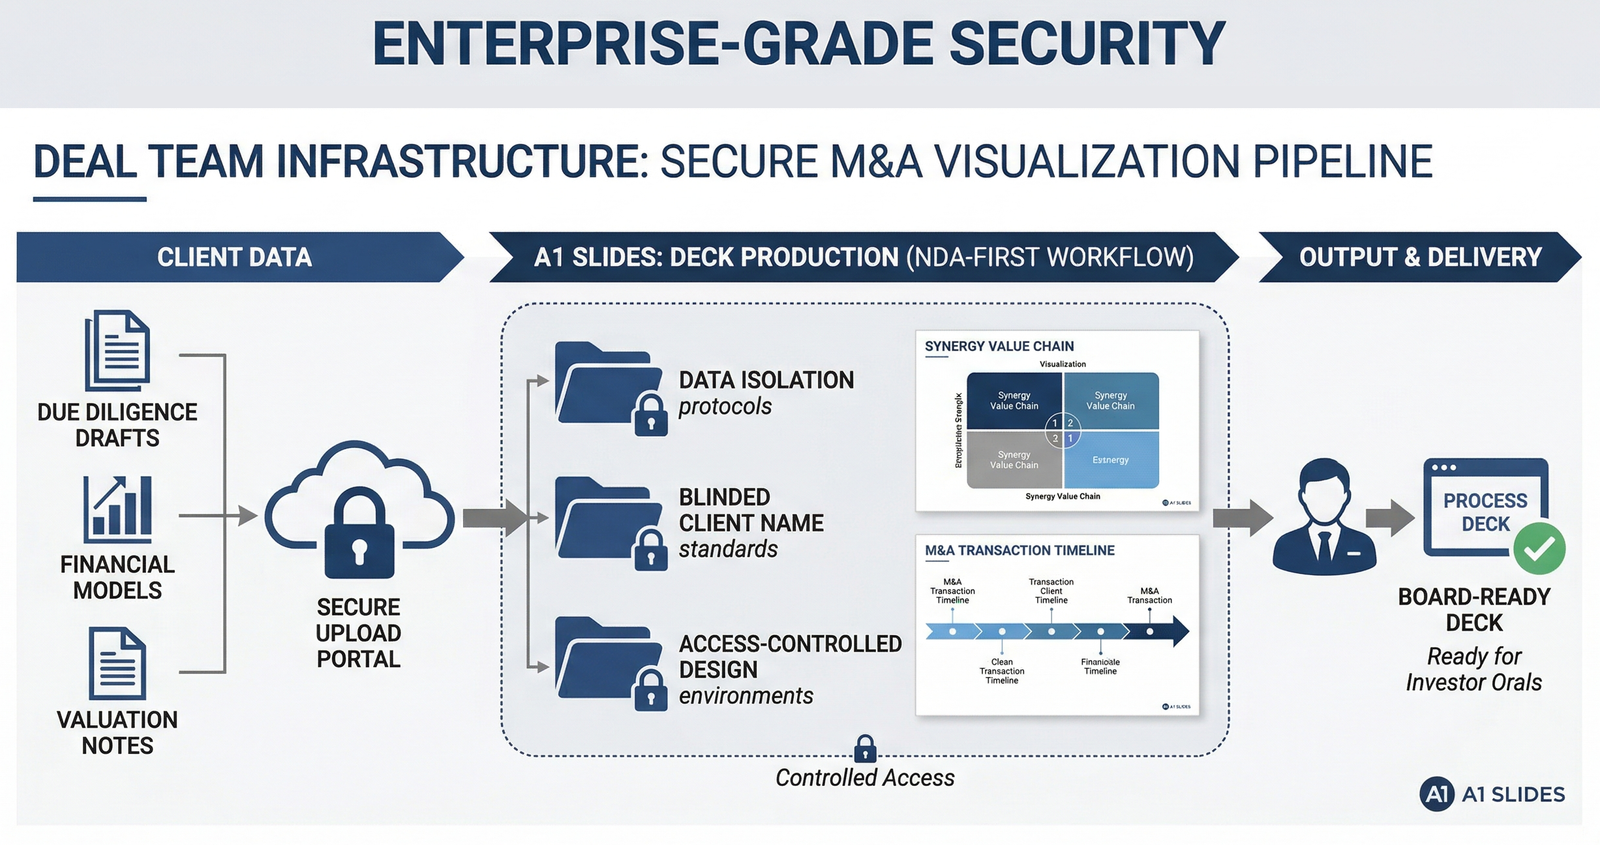
Deal Team Infrastructure: Secure M&A Visualization at Scale
Global consulting and investment firms routinely trust A1 Slides with their most confidential strategic outputs, from multi-billion dollar pre-IPO data to complex restructuring plans. We are your confidential production partner, engineered to provide a secure and operationally sound visualization pipeline:
NDA-First Workflows
We operate under strict Data Isolation protocols, ensuring proprietary M&A targets and sensitive financial models are ring-fenced within access-controlled design environments.
M&A Literacy
We speak the language of corporate development. We specialize in visualizing the critical components of a transaction, including custom M&A Transaction Timelines, Value Chains, and Synergy Matrices, ensuring your logic is MECE before sunset.
Statistical Rigor: Turning Cross-Tabs into Leadership Stories
Global research firms face a common bottleneck: how to turn massive, technically dense survey outputs (e.g., Cross-Tabs, Regression Analyses, Segmentation Models) into clear executive narratives. We are your scalable production engine:
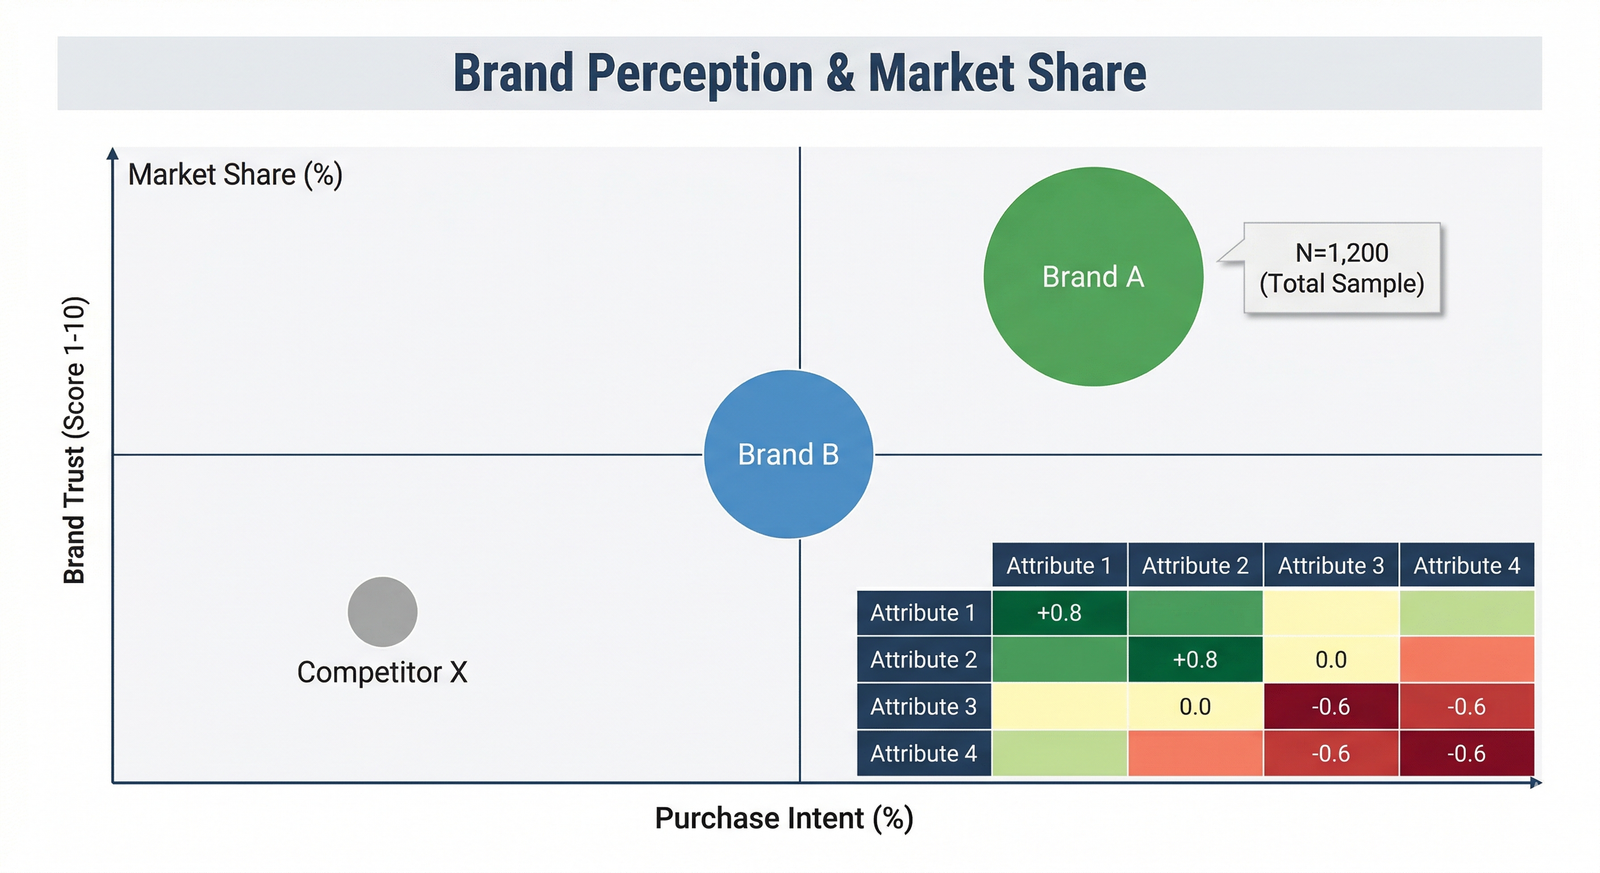
Visualizing Complexity
We specialize in moving beyond basic charting to construct multi-layered visual summaries, such as Bubble Charts that cross-tabulate Brand Trust, Purchase Intent, and Market Share simultaneously.
Statistical Drivers
We engineer Correlation Heatmaps and Regression Segmentation Trees that illuminate the specific drivers of a customer's decision-making process.
Brand Integrity
We ensure that every custom chart is pixel-perfect, respecting your firm’s native brand governance while accelerating the client’s ability to find the "So What?" of the data.
Winning the "Orals": Visual Strategy for Bid Defense
When the contract is on the line, standard design isn't enough. We engineer "Orals" presentations that act as a visual accelerator for your pitch team, differentiating your firm from the competition:
Zero-Friction Clarity
Executives decide in 6 seconds. We build "Ghost Decks" that visualize the "So What?" of your recommendation instantly.
Dynamic Q&A Support
We architect "Appendix Strategy" layers, ensuring your team can navigate complex queries (Financials, Implementation, Risk) with precision.
Pyramid Principle Alignment
Every visual supports a logical argument (Situation-Complication-Resolution), ensuring your narrative is collectively exhaustive (MECE).
Ghost Deck Basics
Definition
A ghost deck is a skeleton PowerPoint with action titles, lead sentences, and rough exhibit placeholders. It locks the narrative before production begins.
Who uses it
McKinsey, BCG, and Bain all use this method. McKinsey often calls the internal version a shell or skeleton, then its VGI production centre builds the final deck overnight.
Why it matters
If the logic breaks in the ghost deck phase, no design will fix it. Structure first, production second.
Production gap
Teams know ghost decks, but the bottleneck is turning a skeleton into a board-ready deliverable in 24 hours. A1 Slides does this as overnight consulting presentation support.
What Is a Ghost Deck?
A ghost deck, shell deck, or skeleton deck is a 20% complete consulting presentation built before visual production. It captures the logic of the recommendation before anyone spends hours formatting slides.
Typical contents include:
Action titles
Lead sentences
Rough exhibit placeholders
Blank body space
Why Consulting Firms Use Ghost Decks — The 80/20 Logic
Ghost decks help teams fail fast and cheaply. A Partner can review the argument, reject weak logic, and redirect the team before production hours are wasted. That is classic 80/20 consulting: solve the structure that drives the decision before perfecting the last 20% of design detail.
The same discipline helps client alignment. Stakeholders can react to the storyline, exhibits, and recommendation before the deck becomes visually expensive to change.
Ghost Deck vs. Shell Deck vs. Skeleton Deck — What's the Difference?
| Term | Firm | What It Means |
|---|---|---|
| Ghost deck | McKinsey | Skeleton presentation with action titles, leads, exhibit placeholders — ~20% complete |
| Shell deck | BCG | Equivalent to ghost deck — same method, different label |
| Skeleton deck | Bain, general usage | Same concept — structural outline before production |
| Straw man | Various | Deliberately imperfect first draft to provoke feedback; slightly more complete |
| Mickey Mouse Master | McKinsey internal | Ghost deck sketched on 3×3 grid paper |
In practice, these terms are often interchangeable. The label changes by firm; the method stays the same: structure before production.
How to Build a Ghost Deck — Step by Step
Define the governing thought — the one recommendation the entire deck must prove.
Map the horizontal logic so the action titles tell a complete story when read in sequence.
Apply Pyramid Principle structure: Situation, Complication, Resolution, and Proof.
Sketch exhibit placeholders for each slide before designing any chart.
Tag data availability through stickering so missing inputs are visible before production.
Review the ghost deck before production so logic errors are fixed while they are still cheap.
Send the approved structure to production — McKinsey VGI internally, or A1 Slides as an external overnight production partner.
The McKinsey VGI Model — and What It Means for Everyone Else
McKinsey's VGI model separates consulting logic from slide production. Consultants send structured shells to a specialist production centre; the centre turns them into final slides while the consulting team keeps solving the client problem.
A1 Slides acts as an external VGI equivalent for boutique and mid-size strategy consultancies that need McKinsey presentation framework and Pyramid Principle production support without building an internal overnight studio.
Ghost Deck Examples — What Each Element Looks Like in Practice
| Weak Title | Strong Action Title |
|---|---|
| Revenue Analysis | Q3 Margins Dropped 4% Due to Supply Chain Delays — Requiring Immediate Procurement Restructuring |
| Market Overview | Southeast Asian Biosimilar Market Will Grow at 14% CAGR Through 2028, Driven by Patent Expiries |
| Competitive Landscape | Three Competitors Have Already Entered the Payer Channel — Our Window for First-Mover Position Closes in 18 Months |
| Team and Resources | Current Headcount Cannot Support the Launch Timeline Without External Capacity by Q2 |
| Recommendation | Partnering With a Regional Distributor Reduces Market Entry Cost by 60% Versus Direct Launch |
Ghost deck slide structure example
[Action Title]: Southeast Asian Biosimilar Market Will Grow at 14% CAGR Through 2028
[Lead]: Patent expiries and payer pressure are creating a near-term entry window.
[Exhibit placeholder]: Bar chart showing market growth by year and patent cliff timing.
[Data]: IN PROGRESS — Vaidehi to confirm by Thursday
Common Ghost Deck Mistakes — and How to Avoid Them
Using topic labels instead of action titles.
Building in PowerPoint too early.
Skipping exhibit placeholders.
Reviewing with the wrong stakeholder.
Treating the ghost deck as optional.
What Happens After the Ghost Deck Is Approved
Once the logic is approved, the team packages the ghost deck with source data, brand guidelines, chart notes, citations, and stakeholder comments. The approved file can be sent at 6 PM and returned as a finished, editable PowerPoint by 8 AM.
This same workflow supports pharma and life sciences ghost deck production, MSL and medical affairs deck design overnight, biotech investor deck overnight production, and UK life sciences strategy consultancies.
For broader logic and slide-writing standards, see the McKinsey presentation framework and our guide to how to create McKinsey-style slides.
Frequently Asked Questions
A ghost deck is an early skeleton version of a consulting presentation. It contains action titles, lead sentences, and rough exhibit placeholders before final design or data production begins.
There is no meaningful difference. McKinsey commonly uses ghost deck or shell terminology, BCG often refers to shell decks, and Bain or general consulting teams may call the same structure a skeleton deck.
Start with the governing thought, map the horizontal logic, write action titles, add lead sentences, sketch exhibit placeholders, tag missing data, review the structure with stakeholders, and only then move into PowerPoint production.
McKinsey's Visual Graphics India model is a production system where consultants send structured ghost decks or shells to a specialist production team that turns them into finished client-ready slides, often overnight.
An action title is a slide headline that states the insight, implication, or recommendation. It replaces generic topic labels and allows the storyline to be understood by reading only the slide titles.
Yes. A1 Slides works as an external VGI-style production partner for consulting teams, turning approved ghost decks into polished, editable, board-ready PowerPoint presentations overnight.