Visualizing Market Size: Nailing Your TAM, SAM,&
SOM Slide in PowerPoint
-
 Author:
Harish K Saini
Author:
Harish K Saini
- April 14, 2025
- Category: Tutorial
Visualizing Market Size: Nailing Your TAM, SAM, & SOM Slide in PowerPoint
Presenting your business strategy or pitching for crucial startup funding? You know the market opportunity is substantial, but simply stating large numbers won’t cut it. Effectively communicating your market size requires defining and visually presenting TAM, SAM, and SOM – Total Addressable Market, Serviceable Available Market, and Serviceable Obtainable Market.
Mastering the market size slide in your PowerPoint presentation is vital. It demonstrates strategic insight, validates your business’s potential, and significantly builds confidence with investors or stakeholders. This guide explains TAM, SAM, and SOM and provides expert tips on how to design and visualize these metrics effectively for maximum impact.

Decoding TAM, SAM, and SOM: What Investors Need to See
Let’s clarify these fundamental market sizing terms:
TAM (Total Addressable Market):
The “universe” – the maximum possible global revenue or demand for your type of product or service, assuming no barriers. It shows the total potential scale.
SAM (Serviceable Available Market):
The portion of TAM your business can realistically target given your specific solution, business model, and geographic reach. It defines your accessible market segment.
SOM (Serviceable Obtainable Market):
Your near-term target – the slice of SAM you can realistically capture (often within 1-3 years) with your current resources, strategy, and team.
This is your achievable market share objective and a key focus for investors.
Why Your TAM/SAM/SOM Slide is Critical for Presentations
This isn’t just business jargon; visually presenting these metrics clearly achieves key goals:
Quantifies the Opportunity:
Puts a clear number on the market potential.
Demonstrates Strategic Focus:
Puts a clear number on the market potential.
Validates Your Business Model:
Connects market size to your revenue potential.
Justifies Investment:
Helps investors understand the potential ROI.
Builds Credibility:
Proves thorough market research and strategic thinking.
How to Visualize TAM, SAM, & SOM Effectively in PowerPoint
Visual clarity is paramount. Your audience should instantly understand the relationship (TAM > SAM > SOM). Common and effective visualization methods include:
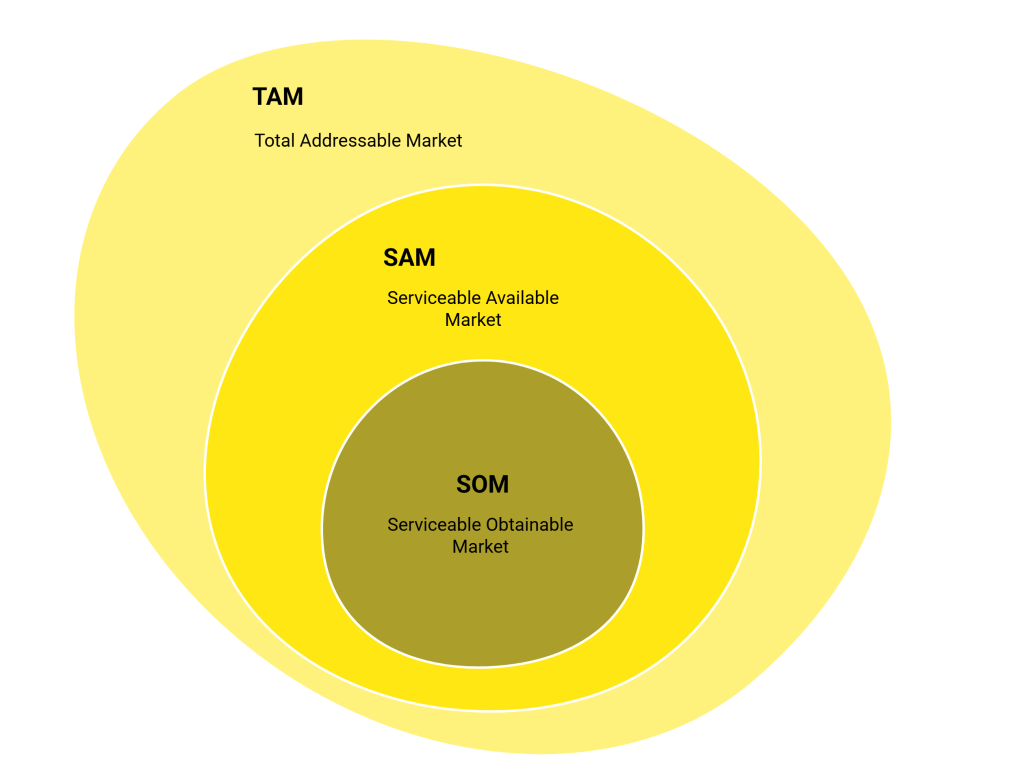
Nested/Concentric Circles:
The most popular method. Use three circles, one inside the other, clearly labeled with TAM (outer), SAM (middle), and SOM (inner), each showing its dollar value. This intuitively illustrates the subset structure.
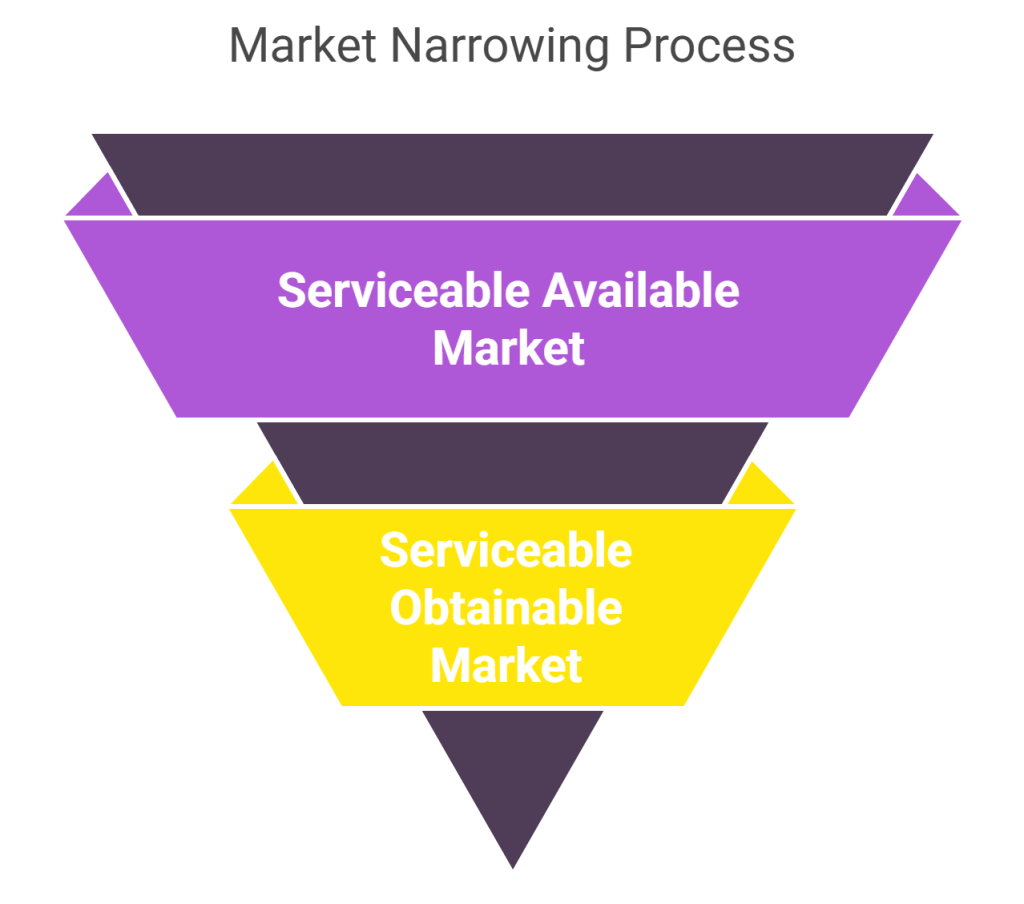
Funnel Diagram:
Shows the market narrowing from the broad TAM at the top down to the targeted SOM at the bottom.
Simple Bar Chart:
Compare the monetary value ($) of TAM, SAM, and SOM side-by-side using clearly labeled bars.
Market Size Comparison ($)
Design Best Practices for Your PowerPoint Market Size Slide
- Maximize Clarity & Simplicity: Ensure labels (TAM, SAM, SOM, and $ values) are instantly readable. Use clean lines and ample white space – avoid clutter!
- Use Consistent Branding: Apply your presentation’s color scheme and fonts for a professional, cohesive look.
- Establish Credibility: Briefly state your calculation method (e.g., “Bottom-up from industry reports”) and cite reputable data sources. Transparency builds trust. (Tip: Always have backup data ready if asked).
- Highlight the Obtainable Market (SOM): While TAM shows vision, investors focus on your ability to capture the SOM. Ensure this number is realistic and linked to your strategy.
- Provide Context: Use the slide title or a brief statement to explain what this market size means for your growth trajectory. Interpret the data, don’t just display it. (See our guide on data visualization tips).
Avoid These Common Mistakes on Your Market Size Slide
Steer clear of these errors that can damage your credibility:
- Inflated or Unrealistic Numbers: Base figures on solid research and reasonable assumptions.
- Lack of Data Sources: Always cite where your numbers came from.
- Confusing or Unlabeled Visuals: If the chart isn’t immediately clear, simplify it.
- Vague Definitions: Ensure it’s clear how your business defines its TAM, SAM, and SOM.
- Disconnect from Strategy: Your SOM must align with your go-to-market plan – be ready to explain how you’ll achieve it.
Tell Your Market Story Clearly
Effectively presenting your TAM, SAM, and SOM in PowerPoint is crucial for strategic communication. It requires understanding the concepts, choosing the right visualization, and designing the slide for maximum clarity and credibility. Get this right, and you provide a compelling snapshot of your ambition and your grounded plan to achieve it.
Author Insights:
Mr. Harish K. Saini
Presenting complex market data requires strategic clarity, a skill honed by experienced business leaders like Mr. Harish K. Saini. As an entrepreneur who has founded companies and a mentor guiding startups and established firms, Harish understands the critical importance of demonstrating market understanding to stakeholders and investors. His background in business growth strategy ensures that the focus remains on credible data presented effectively. Connect with Harish on https://www.linkedin.com/in/harishksaini/ or https://harishksaini.com/
Looking for help in presentation designing?
Checkout out our PPT design services
With 1000+ presentations in 50+ industries, in 10+ countries, A1 Slides has helped corporates, Govts & Enterprises communicating better with impressive slides.