Technical PowerPoint Capabilities:
The Hidden Features That Will Transform Your Presentations

Powerpoint software is a beast, and its power has not been utilised by most users. Reason? In the evolution of PowerPoint, there have been major additions that made it an ideal choice among many alternatives to PowerPoint software. They are unaware of the technical features of PowerPoint. PowerPoint is far more than just a simple slideshow creator. Beneath its familiar interface lies a powerful toolset that many intermediate users have yet to discover. In this deep dive, we’ll explore some of PowerPoint’s most valuable technical capabilities, from advanced data visualisation to automation features that can save you hours of work.
1. Morph Transition: The Animation Game-Changer
Where to find it: Transitions tab → Morph (in the Transition to This Slide group)
How to use it: Create two slides with some of the same objects. On the second slide, change the position, size, or appearance of these objects. Apply the Morph transition to the second slide.
Practical use case: When you want to zoom in on a specific part of a diagram or smoothly transition between different states of an object.
Example: Imagine you have a complex process flow. Create one slide showing the entire flow, then duplicate it. On the duplicate, enlarge one section of the flow and delete the rest. Apply Morph, and when you present, PowerPoint will smoothly zoom in on that section as if using a camera.
2. PowerPoint's Hidden 3D Models and Animations
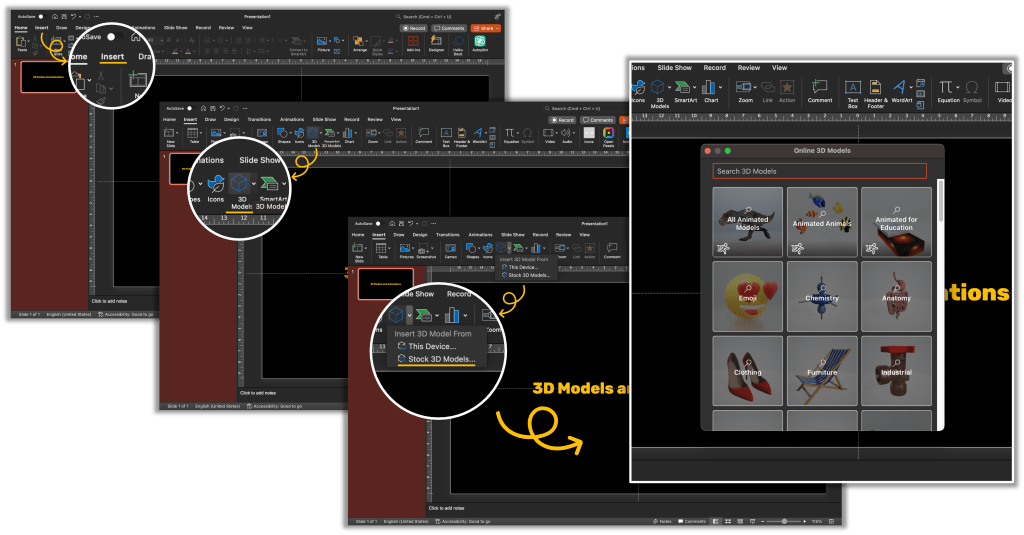
Where to find it: Insert tab → 3D Models → Stock 3D Models (or From File)
How to use it: Insert a 3D model, then use the 3D Model Tools format tab to adjust the position, lighting, and scene. You can also animate the model using the Animation tab.
Practical use case: Product demonstrations, architectural presentations, or any scenario where you need to show an object from multiple angles.
Example: For a technical presentation on a new device, insert a 3D model of a similar product. Use the 3D rotation tools to show it from different angles throughout your presentation. You can even create a sequence of animations that rotate the model to highlight specific features.
3. PowerPoint Designer: AI-Powered Design Assistant
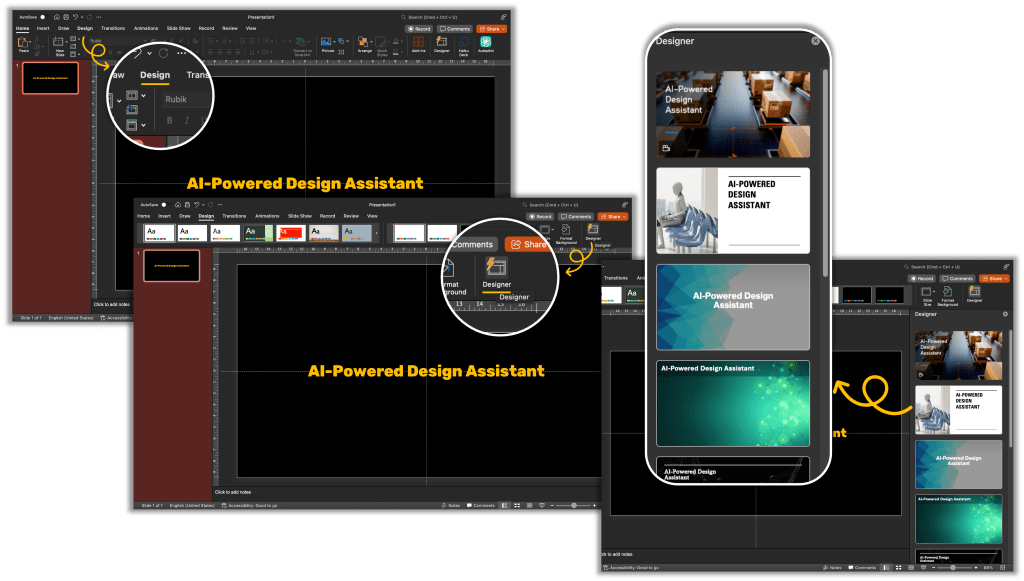
Where to find it: Design tab → Design Ideas (Make sure you’re connected to the internet)
How to use it: Add content to your slide (text, images, etc.), then click Design Ideas. PowerPoint will suggest various professional layouts based on your content.
Practical use case: When you need to quickly create professional-looking slides but don’t have time for extensive design work.
Example: When presenting quarterly results, paste in your data and a few key images. Click Design Ideas, and PowerPoint will suggest various ways to arrange the content that highlight your key metrics while maintaining visual appeal.
4. Smart Lookup: Integrated Research Tool
Where to find it: Right-click on a word or phrase → Smart Lookup, or Review tab → Smart Lookup
How to use it: Select a word or phrase in your presentation, then use Smart Lookup to search for related information without leaving PowerPoint.
Practical use case: When you need to verify facts or gather additional information while creating your presentation.
Example: While creating a presentation on renewable energy, you can use Smart Lookup on terms like “solar efficiency” to quickly find current statistics and expert definitions to incorporate into your slides.
5. Zoom Links: Non-Linear Presentations
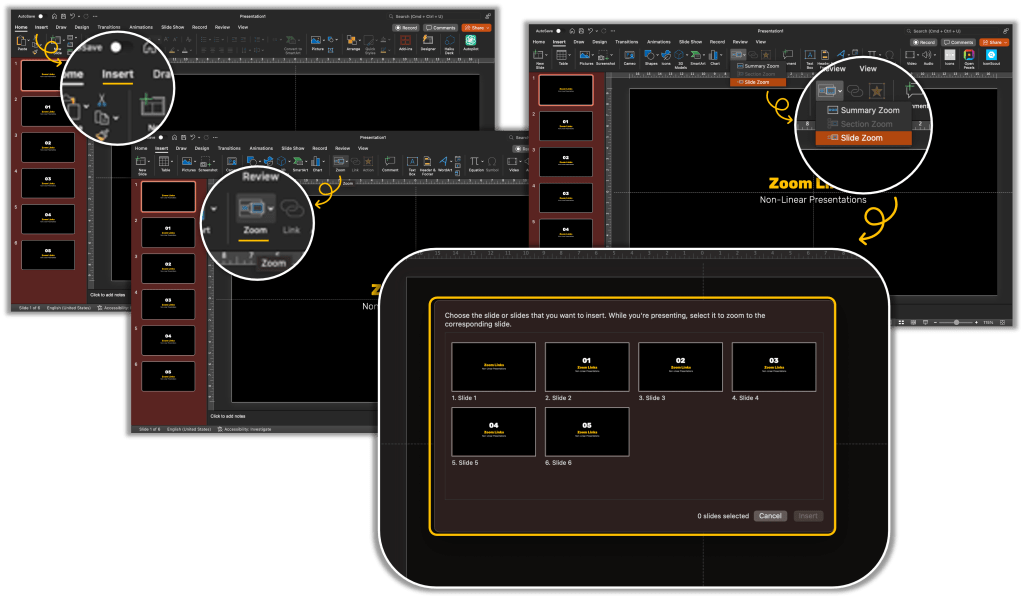
Where to find it: Insert tab → Zoom → Slide Zoom, Section Zoom, or Summary Zoom
How to use it: Create sections in your presentation, then use Zoom to create an interactive table of contents that allows you to jump to any section.
Practical use case: For presentations where you might need to adjust your content flow based on audience interest or time constraints.
Example: During a product training session, create a Summary Zoom slide with links to different product features. This allows you to click on whichever feature the audience is most interested in, rather than following a fixed sequence.
6. Embedded Excel Spreadsheets: Live Data Manipulation
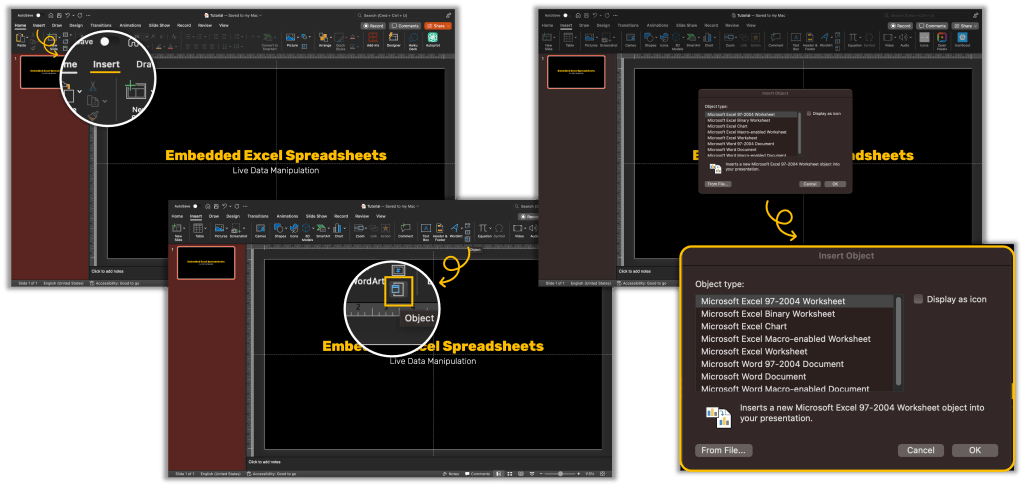
Where to find it: Insert tab → Object → Microsoft Excel Worksheet
How to use it: Insert an Excel object directly into your PowerPoint slide. You can edit the data right in PowerPoint, and it maintains all Excel functionality.
Practical use case: When you need to demonstrate data calculations or want the ability to update numbers during your presentation.
Example: For a financial presentation, embed an Excel spreadsheet showing your budget projections. During the presentation, you can adjust variables like growth rate or expenses, and all calculations will update in real-time.
7. Slide Show Shortcuts: Presenter's Secret Weapons
Where to find it: These are keyboard shortcuts available during presentation mode
How to use it:
- Press B to blackout the screen (or W for white)
- Press number + Enter to jump to a specific slide
- Press Ctrl + P for pen mode, Ctrl + A for arrow mode, Ctrl + E for eraser
- Press + or – to zoom in or out on a slide
Practical use case: When you need to maintain complete control over your presentation flow and direct audience attention.
Example: During a technical explanation, use the B key to momentarily blackout the screen and focus audience attention on your verbal explanation. Use the pen tool (Ctrl+P) to circle important elements as you discuss them.
8. PowerPoint VBA: for Complex Tasks
Where to find it: Developer tab → Visual Basic (If the Developer tab isn’t visible, right-click on the ribbon, select Customize the Ribbon, and check Developer)
How to use it: Write VBA code to automate tasks, create custom functions, or add interactive elements to your presentations.
Practical use case: When you need to create truly interactive presentations or automate repetitive tasks.
Example: Create a custom VBA function that pulls real-time data from an external source and updates charts in your presentation. Or program interactive quiz buttons that track and display participant scores.
9. Slide Master: Consistent Design Control
Where to find it: View tab → Slide Master
How to use it: Customize the Slide Master to define consistent design elements across your entire presentation, including fonts, positioning, background elements, and more.
Practical use case: When creating a template for company-wide use or ensuring absolute consistency in a large presentation.
Example: Design a Slide Master with your company’s branding elements positioned exactly where they should appear on every slide. Create custom layouts for different content types (data slides, quote slides, etc.) to ensure design consistency while allowing content flexibility.
10. SVG Graphics: Scalable Vector Illustrations
Where to find it: Insert tab → Icons or Insert tab → Pictures → Online Pictures (search for SVG)
How to use it: Insert SVG graphics, which can be resized without losing quality. You can also ungroup SVGs (right-click → Group → Ungroup) to edit individual elements.
Practical use case: When you need clean, professional icons or illustrations that can be customized to match your presentation’s style.
Example: Insert an SVG flowchart icon, ungroup it, then customize the colors of individual elements to match your brand. Since it’s vector-based, you can scale it to any size without pixelation.
11. Background Removal: Professional Image Editing
Where to find it: Picture Format tab → Remove Background
How to use it: Insert an image, click Remove Background, then use the tools to refine which parts of the image to keep or remove.
Practical use case: When you want to integrate product images or people into your slides without distracting backgrounds.
Example: For a product comparison slide, remove the backgrounds from product images so they appear to float side by side without distracting backgrounds. This creates a clean, professional look without requiring external photo editing software.
12. Hyperlinks to External Documents
Where to find it: Insert tab → Link → Link to File
How to use it: Create a hyperlink to an external document that you can open directly from your presentation.
Practical use case: When you need to reference supporting documents or switch to a demonstration without leaving presentation mode.
Example: During a technical presentation, include hyperlinks to detailed specification documents or software demonstrations that you can instantly access when needed.
13. Custom Shows: Presentations Within Presentations
Where to find it: Slide Show tab → Custom Slide Show → Custom Shows
How to use it: Create multiple versions of your presentation within a single file by defining different sequences of slides.
Practical use case: When you need to tailor your presentation for different audiences without creating multiple files.
Example: For a product presentation, create one custom show highlighting technical specifications for the engineering team, another emphasizing cost benefits for the finance department, and a third focusing on user experience for the marketing team.
14. Advanced Chart Types: Waterfall, Funnel, and More
Where to find it: Insert tab → Chart → All Charts tab
How to use it: Explore the less common chart types like Waterfall, Funnel, Sunburst, and Treemap for visualizing complex data relationships.
Practical use case: When standard charts don’t effectively communicate your data’s structure or relationships.
Example: Use a Waterfall chart to show how different factors contribute to a final value, such as how various expenses reduce gross revenue to net profit. Or use a Sunburst chart to display hierarchical data like organizational structure or market segmentation.
15. Audio and Video Editing Tools
Where to find it: With audio/video selected → Playback tab or Format tab
How to use it: Trim media files, add bookmarks, set fade in/out effects, and control playback options without leaving PowerPoint.
Practical use case: When you need to incorporate precise audio or video clips without using external editing software.
Example: For a training presentation, insert a video demonstration, then use the built-in trim function to show only the relevant portion. Add bookmarks at key points so you can jump to specific sections during your presentation.
Conclusion
These advanced technical capabilities transform PowerPoint from a simple slide-creation tool into a powerful presentation platform. By mastering these features, you can create more engaging, dynamic, and professional presentations while saving significant time and effort.
Remember that the best presentations balance technical capabilities with clear communication principles. Use these tools to enhance your content, not to overwhelm your audience with flashy effects.
Which of these technical PowerPoint capabilities will you try first? Experiment with a few in your next presentation and watch how they elevate your content from ordinary to extraordinary. Don’t hesitate to get a free PowerPoint assesEnterprisent of your experiments or existing deck. If you don’t have time to do an experiment yet and want to utilise its advanced technical tool, then reach out to our PPT Experts.