PowerPoint Power-Up: Master Charts, Timelines, and Videos Like a Pro
Let’s be honest, are your PowerPoint presentations really hitting the mark? If you’re still relying heavily on text-filled slides, you might be losing your audience before you even get to the good stuff. It’s time for a PowerPoint power-up!
PowerPoint is packed with features that can transform your slides from static text dumps into dynamic, engaging visual stories. Ready to unlock that potential and create presentations that command attention? This expert tutorial will guide you through mastering three crucial elements: charts that clarify data, timelines that guide narratives, and videos that captivate viewers.
Make Data Dance: Mastering PowerPoint Charts for Clear Insights
You’ve got the data, but is it connecting? Walls of numbers can be intimidating and, frankly, boring. PowerPoint charts are your secret weapon to make complex information digestible and even exciting.
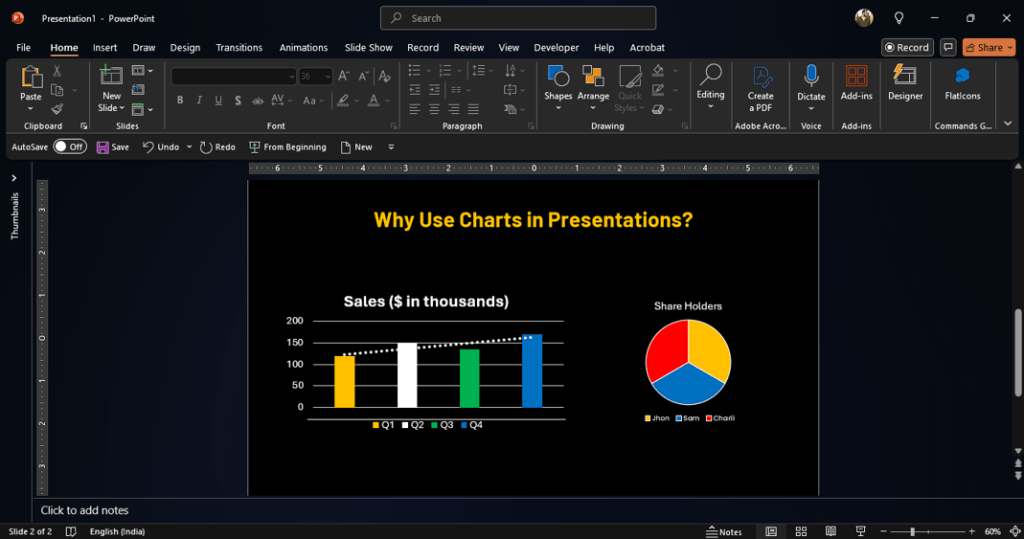
Why Use Charts in Presentations?
Because they instantly reveal relationships, comparisons, and trends that raw numbers hide. Imagine presenting sales figures – a bar or column chart makes yearly growth pop; a pie chart clearly shows market share contributions. It’s about visual clarity and immediate impact.
Pro Tip: Choose chart types wisely! Line charts excel at showing trends over time.
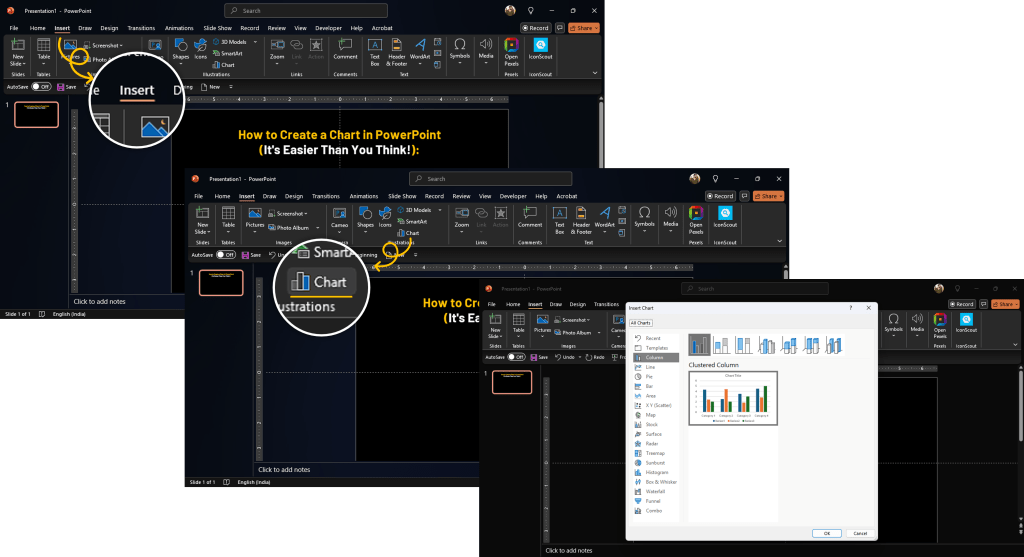
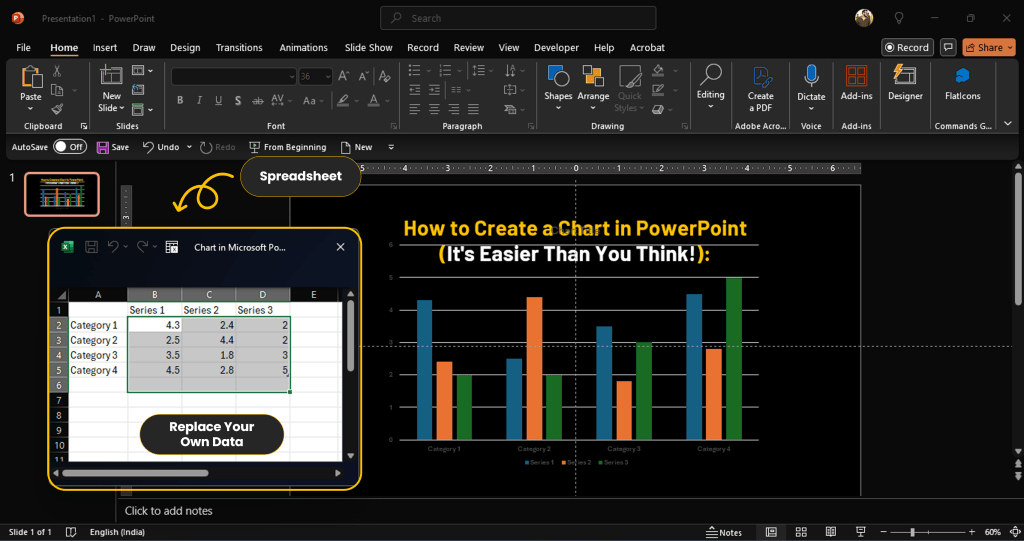
How to Create a Chart in PowerPoint (It's Easier Than You Think!):
Navigate to the Insert tab on the ribbon and click Chart.
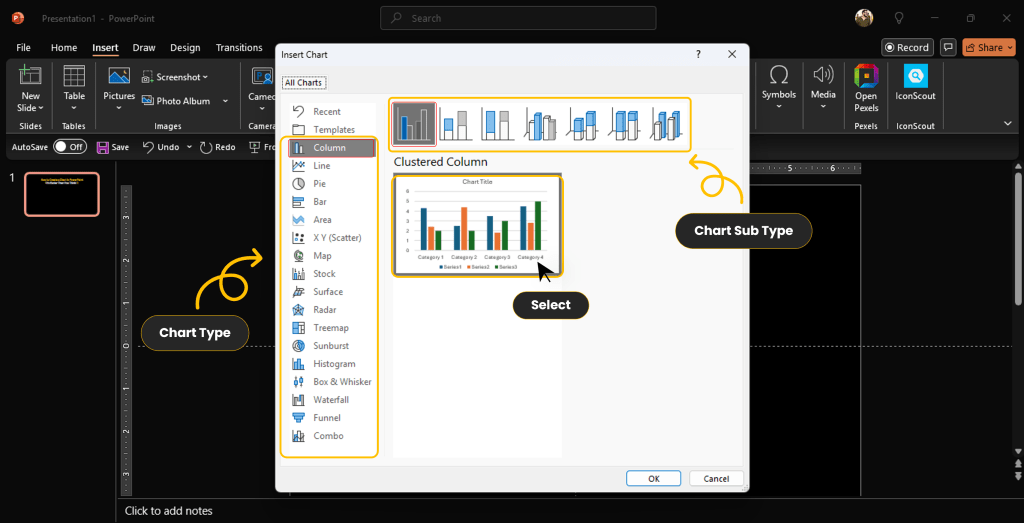
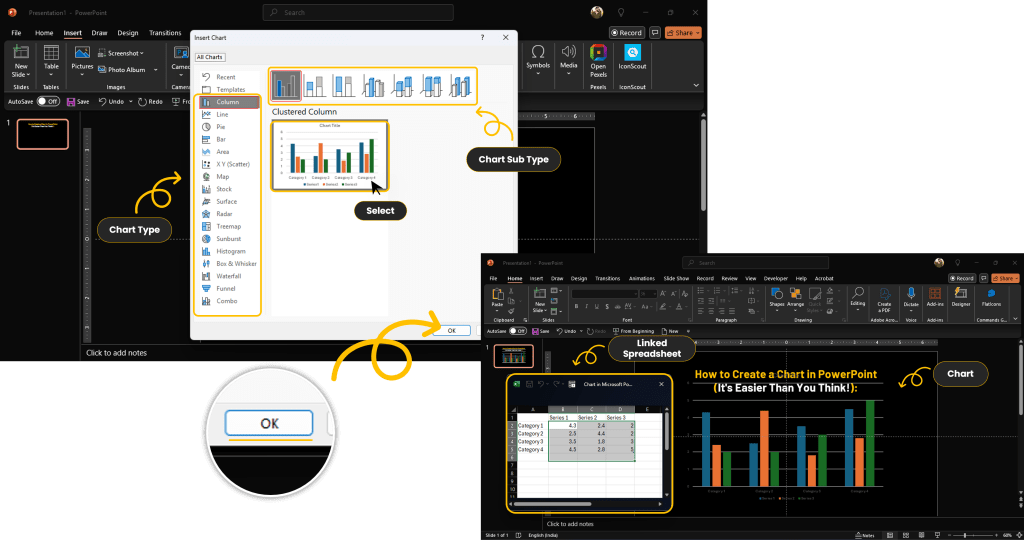
2. Explore the options! Choose the chart type that best tells your data’s story.
3. Click OK. A sample chart and a linked spreadsheet window will appear.
4. Simply replace the sample data with your own information right in the spreadsheet.
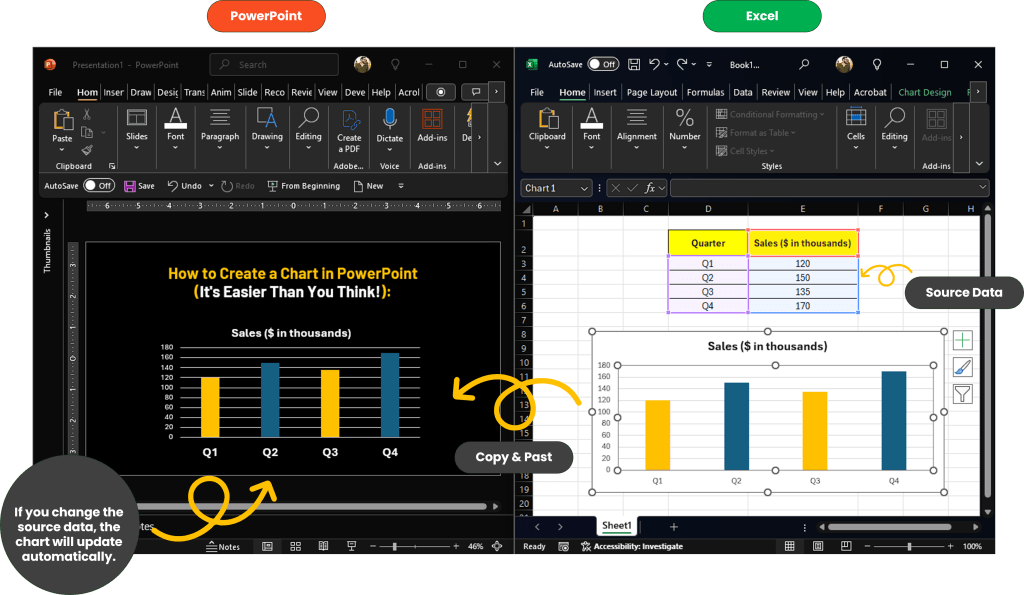
5. Expert Tip: Working with frequently updated Excel data? Create the chart in Excel first. Then, copy and paste it into PowerPoint, selecting the option to keep it linked to the source file. This ensures your chart always reflects the latest numbers automatically!
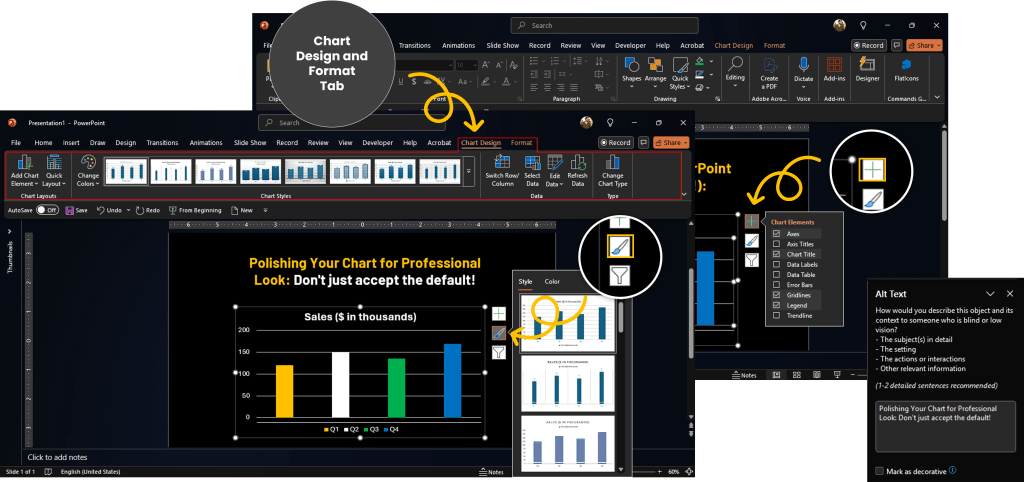
Polishing Your Chart for Professional Look: Don't just accept the default!
Click your chart. Use the quick-access buttons (+) and (brush icon) that appear nearby to easily add chart titles, data labels, or legends (Chart Elements), or instantly change the look and feel (Chart Styles).
For granular control, use the Chart Design and Format tabs on the ribbon. These offer extensive options for customizing colors, fonts, axes, and filtering specific data series. (Accessibility Note: Ensure your chart colors have sufficient contrast and consider adding Alt Text to describe the chart’s purpose for screen readers).
Navigate the Narrative: Creating Clear PowerPoint Timelines with SmartArt
Need to showcase project progress, map out historical milestones, or explain process steps sequentially? Ditch the confusing bullet points and start visualizing the journey with a PowerPoint timeline.
Why Timelines Enhance Understanding: They provide an intuitive, visual roadmap. This helps your audience instantly grasp sequence, duration, and key stages, making your narrative easier to follow.
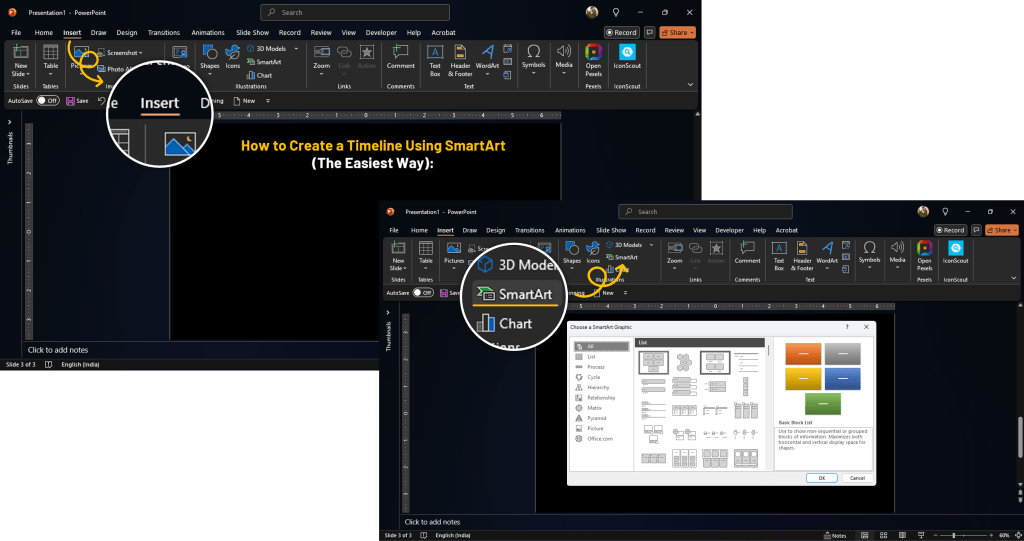
How to Create a Timeline Using SmartArt (The Easiest Way):
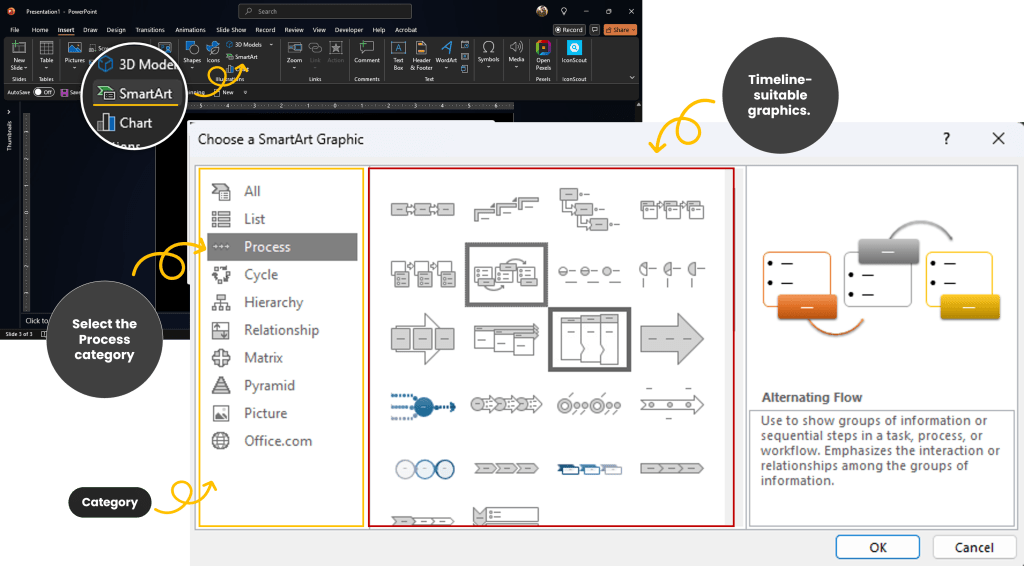
1. Go to Insert > SmartArt.
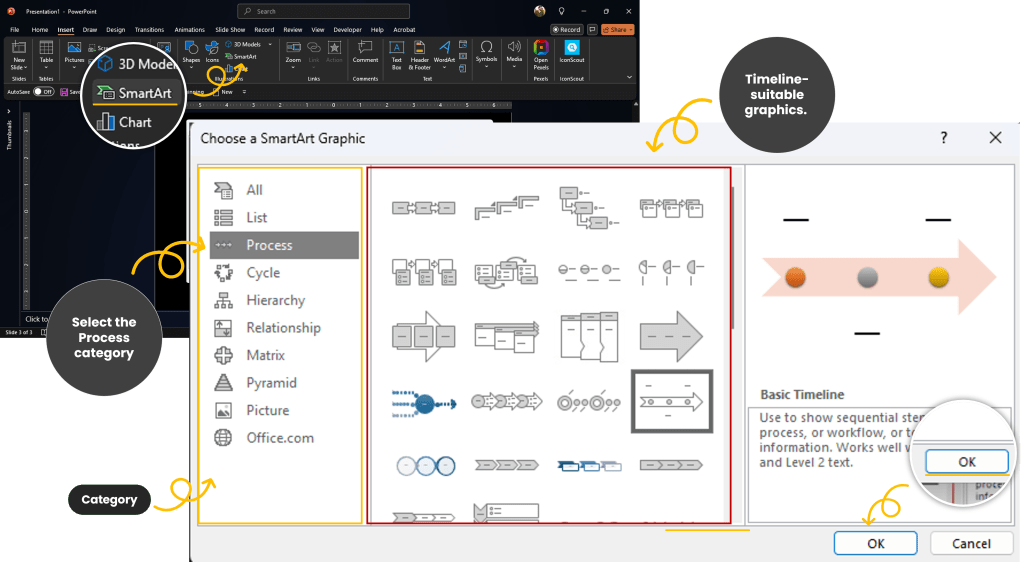
2. Select the Process category from the left-hand list – this contains most timeline-suitable graphics.
3. Pick a layout that fits your needs (common choices include “Basic Timeline” or “Circle Accent Timeline”). Click OK.
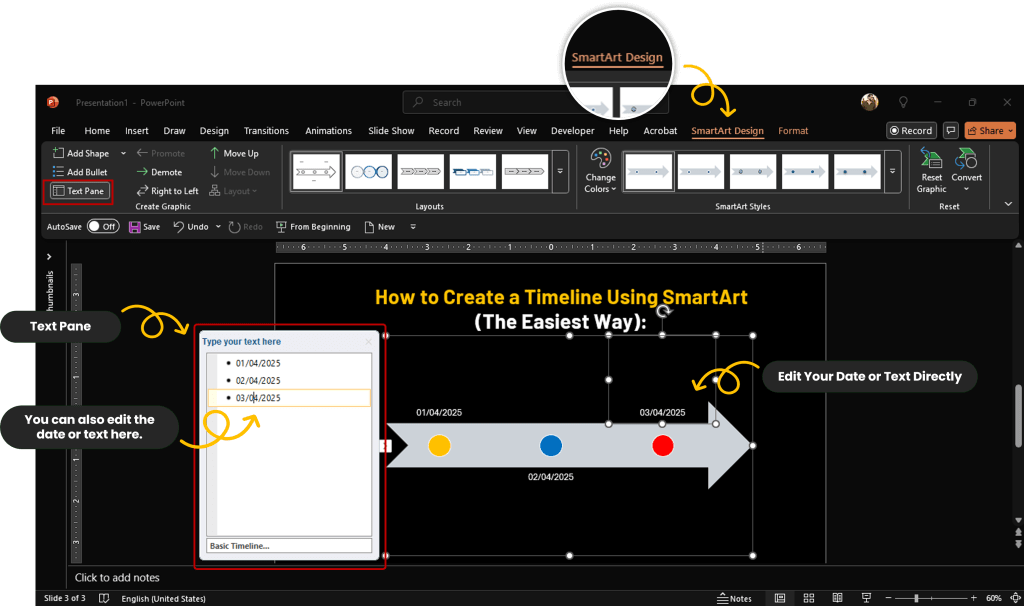
4. A graphic appears on your slide. Type your dates and key milestones directly onto the shapes or use the Text Pane that opens alongside it (if it doesn’t, click Text Pane on the SmartArt Design tab).
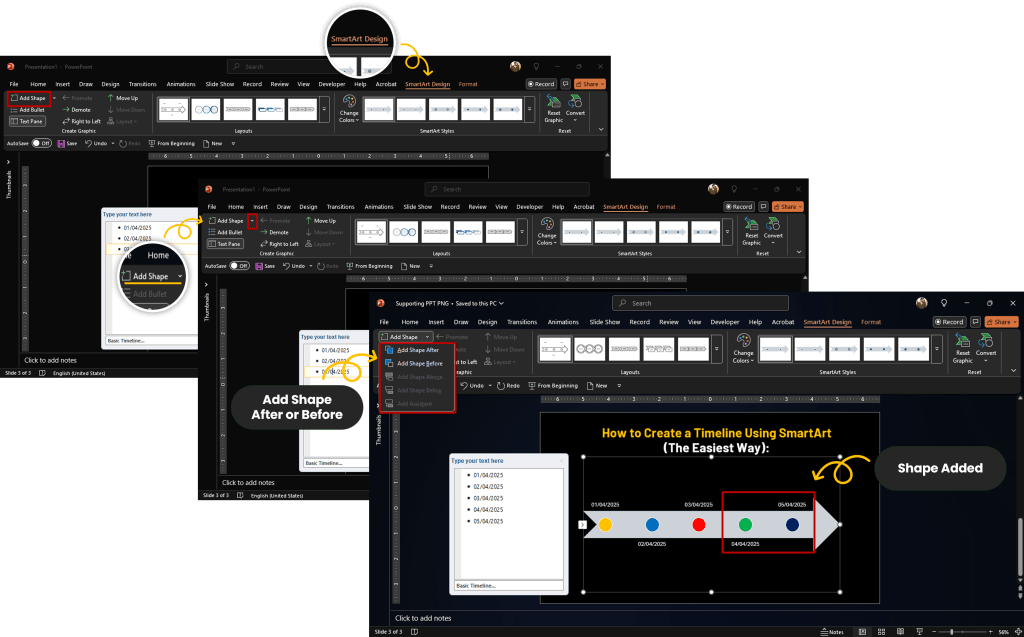
5. Need to add more events? Select the timeline graphic, go to the SmartArt Design tab, and click Add Shape (choose ‘Before’ or ‘After’ as needed).
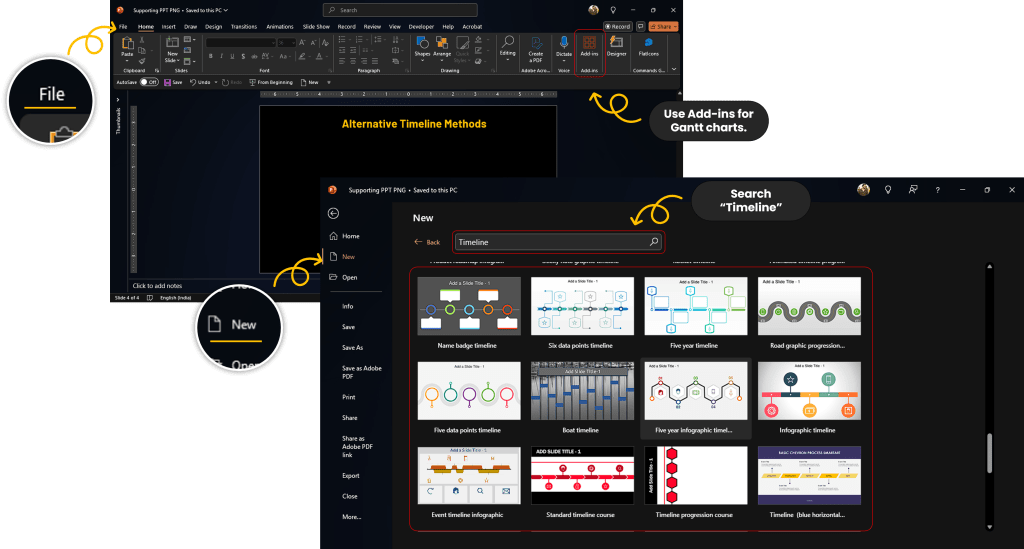
Alternative Timeline Methods:
While SmartArt is often the quickest route for illustrative timelines, PowerPoint also offers pre-designed templates. Find them via File > New > search “timeline”. For highly detailed project management Gantt charts, you might explore specialized PowerPoint add-ins.
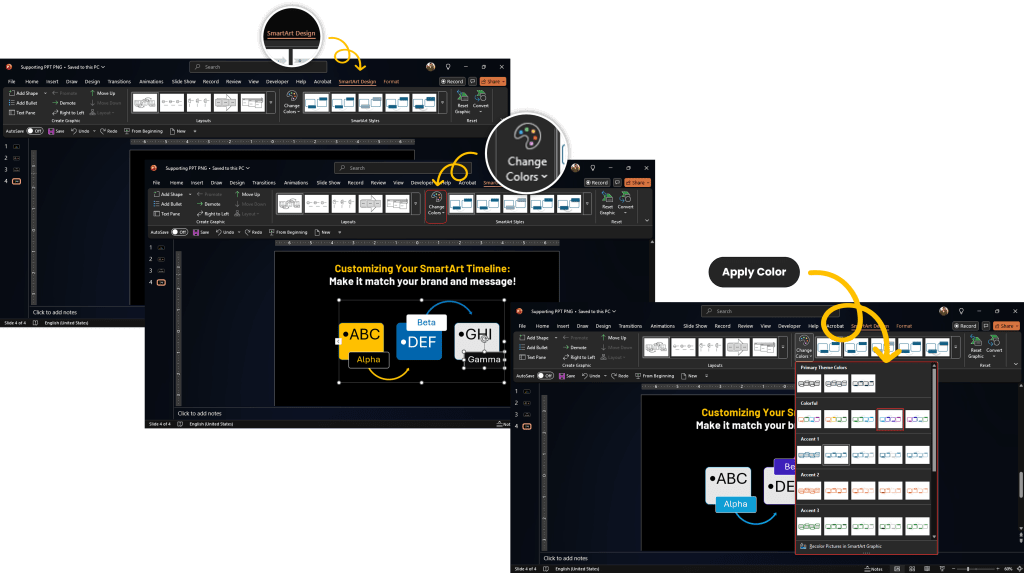
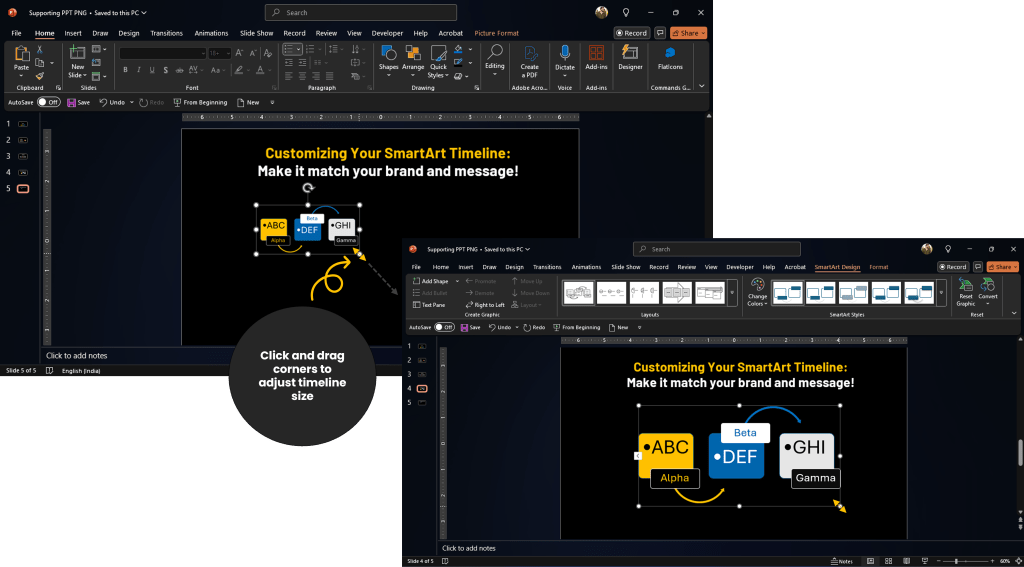
Customizing Your SmartArt Timeline: Make it match your brand and message!
1. Use the SmartArt Design tab to easily apply different Color Schemes and experiment with pre-set SmartArt Styles.
2. Resize the entire timeline graphic by clicking and dragging the corner handles.
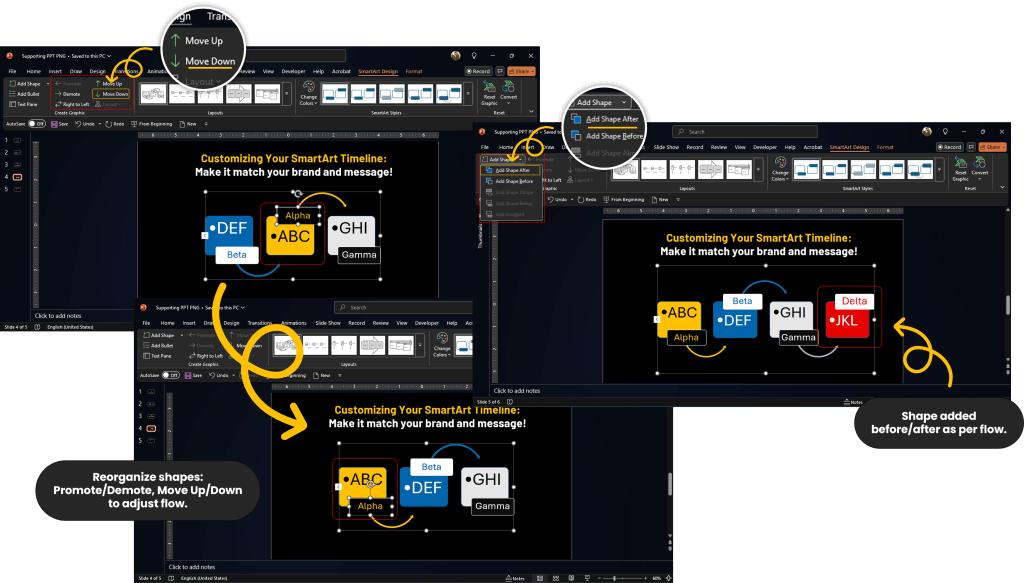
3. Reorganize your events using the Add Shape, Promote/Demote, and Move Up/Down options to refine the flow and hierarchy.
Bring Your Slides to Life: Leveraging Video Power in PowerPoint
Want to instantly grab attention, demonstrate a concept visually, or add a human touch with testimonials? Inserting video in PowerPoint is your answer. Used strategically, it breaks up static content and deepens audience engagement.
Why Video Elevates Presentations:
It adds dynamism, allows you to show instead of just tell, and caters to diverse learning preferences. Think product demos, animated explainers, or customer interviews.
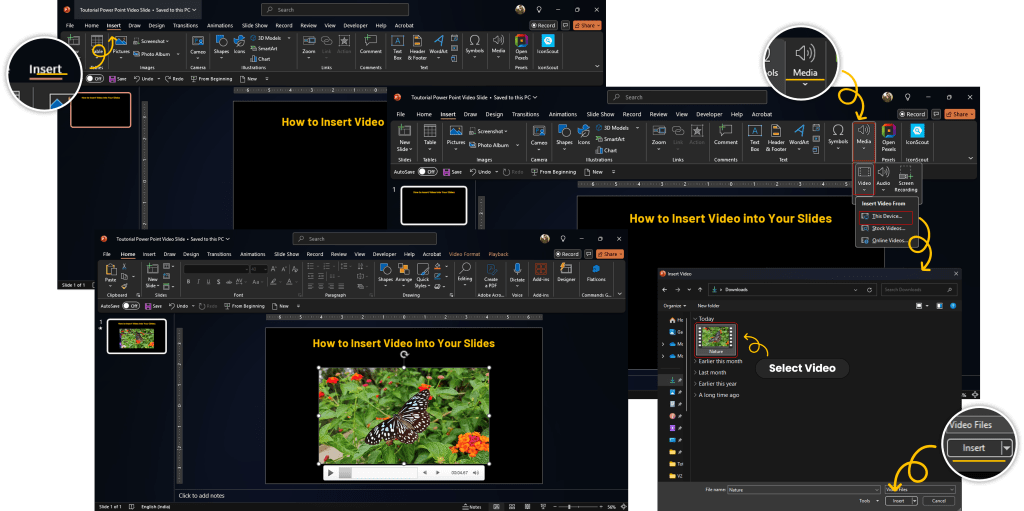
How to Insert Video into Your Slides:
Video Files: Go to Insert > Video > This Device. Browse and select the video file stored on your computer.
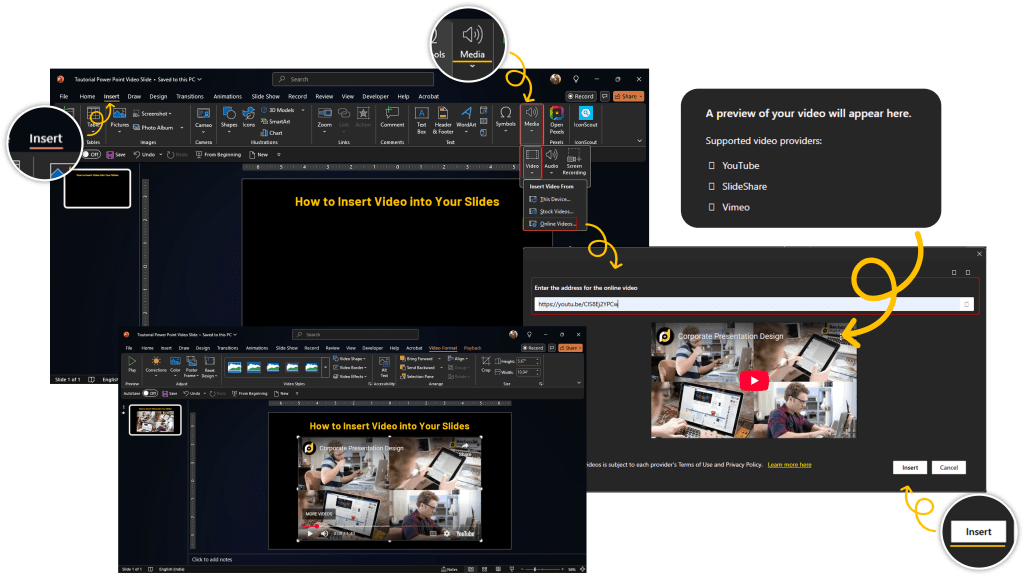
Online Video (e.g., YouTube): Go to Insert > Video > Online Videos. Paste the URL of the video, and PowerPoint will embed it. (Ensure you have the right permissions to use online content).
Become the Director:
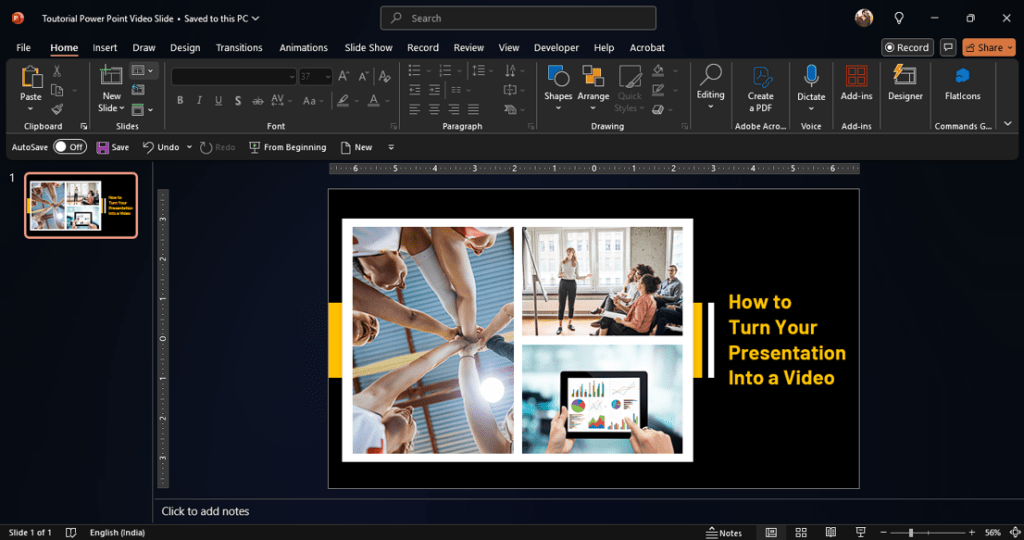
How to Turn Your Presentation Into a Video: This is fantastic for sharing tutorials, creating marketing snippets, or sending asynchronous pitches.
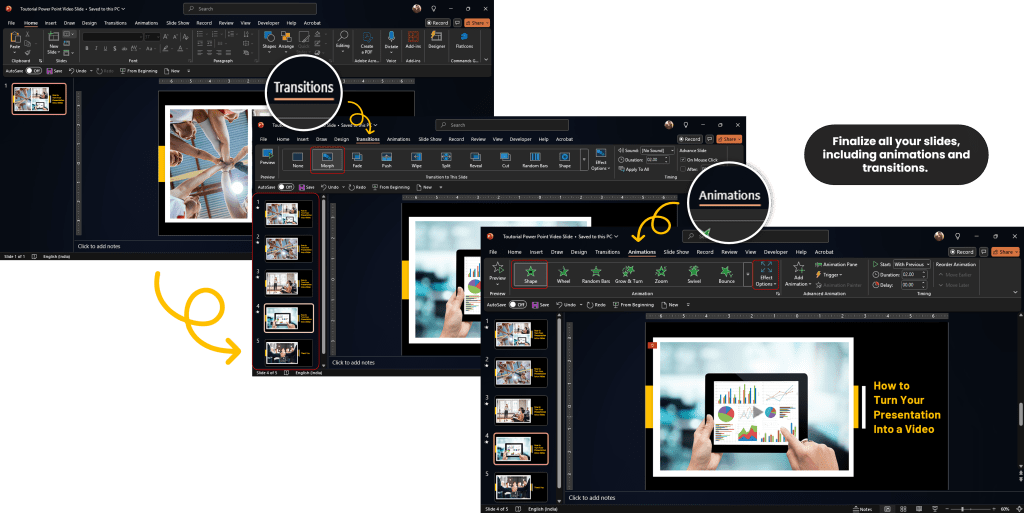
Finalize all your slides, including animations and transitions.
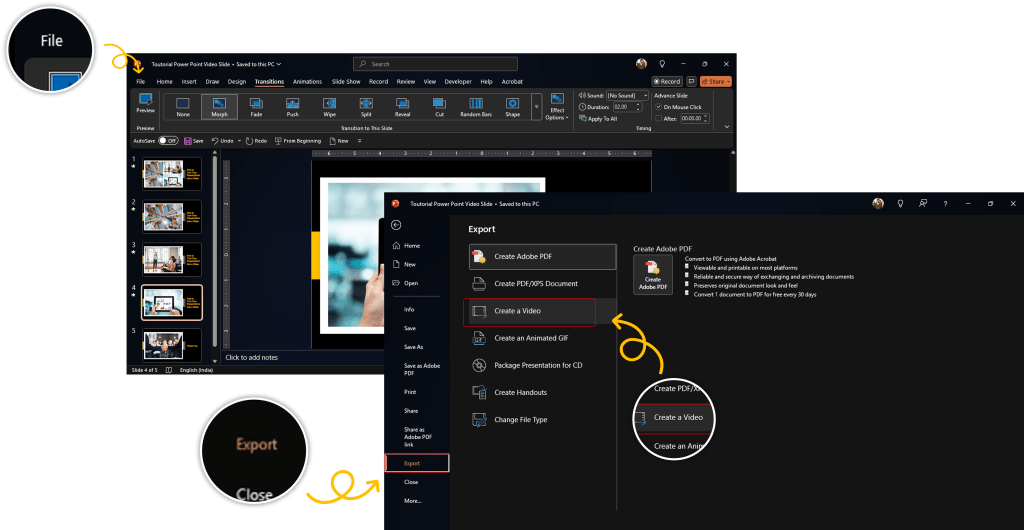
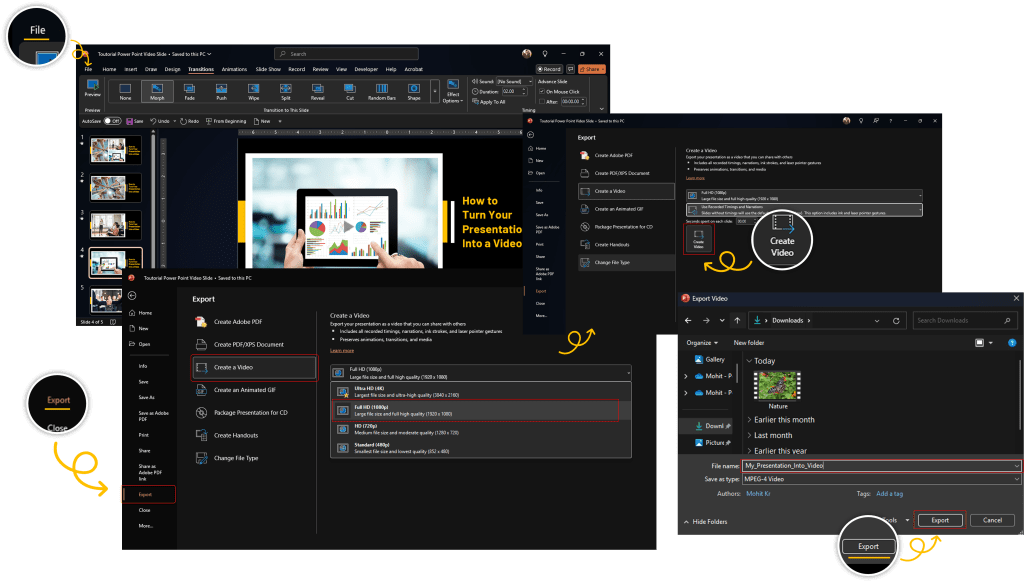
Go to File > Export > Create a Video.
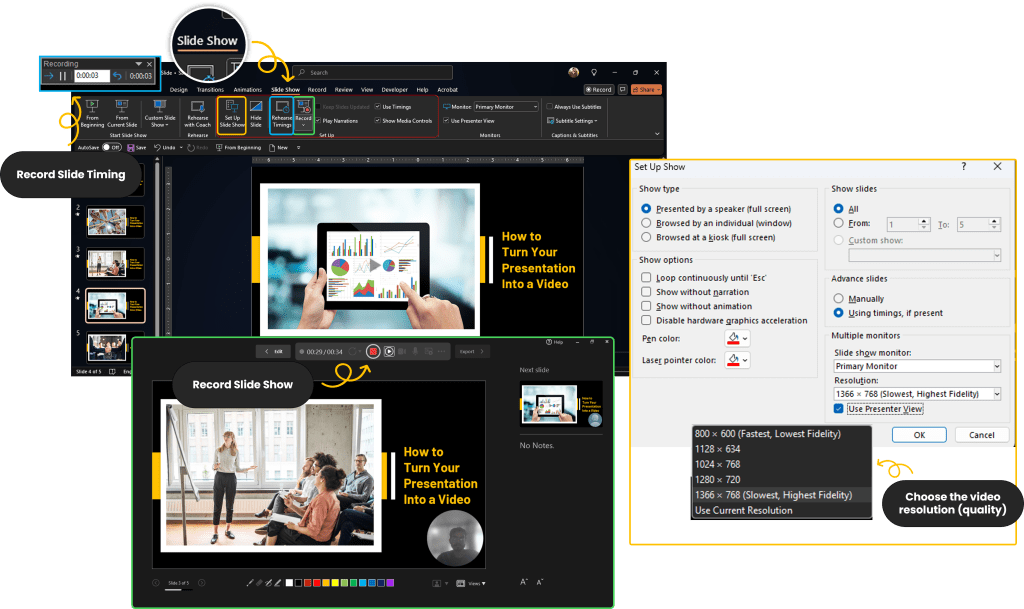
Choose the video resolution (quality) and decide whether to include any recorded narrations or slide timings (you can add these beforehand using Slide Show > Record Slide Show).
Click Create Video, choose a save location, and PowerPoint will export your presentation as an MP4 file.
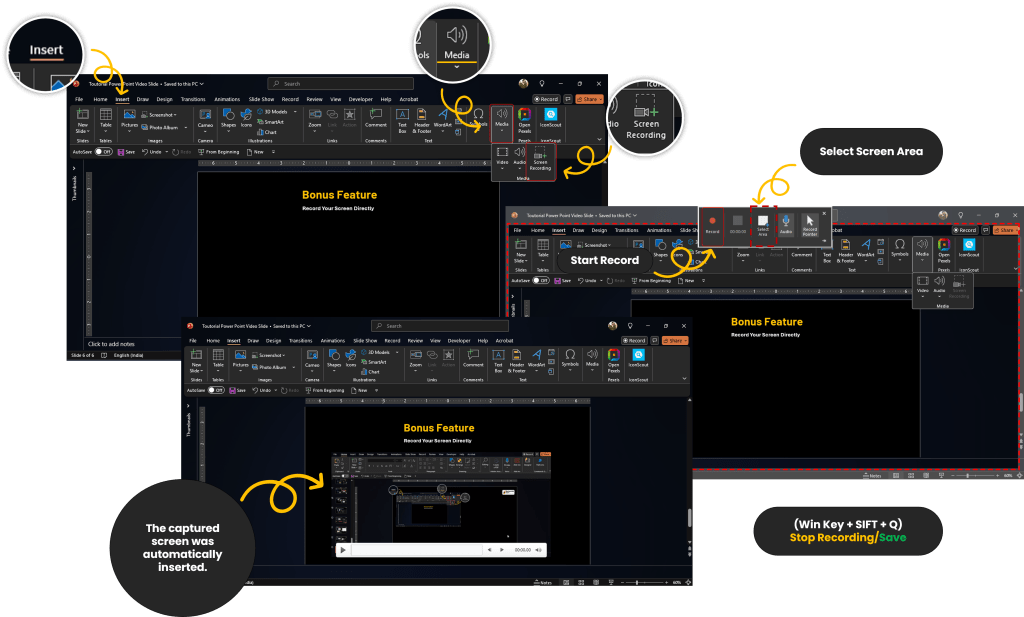
Bonus Feature:
Record Your Screen Directly: Need to demo software or walk through website navigation? Use Insert > Screen Recording to capture the action right onto a slide – incredibly useful for tutorials!
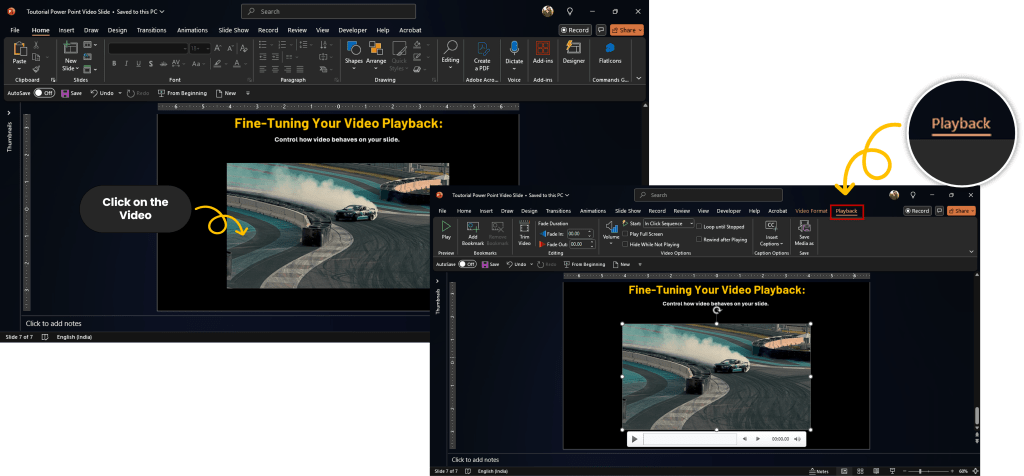
Fine-Tuning Your Video Playback: Control how video behaves on your slide.
Select the inserted video. A Playback tab will appear on the ribbon.
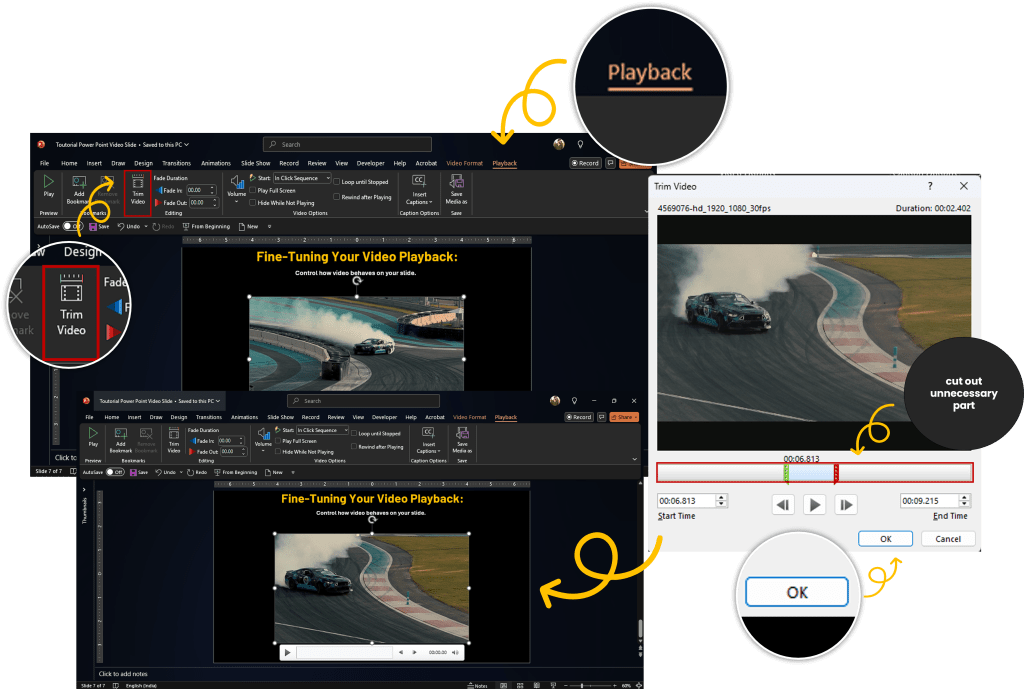
Use Trim Video to cut out unnecessary beginning or end sections.
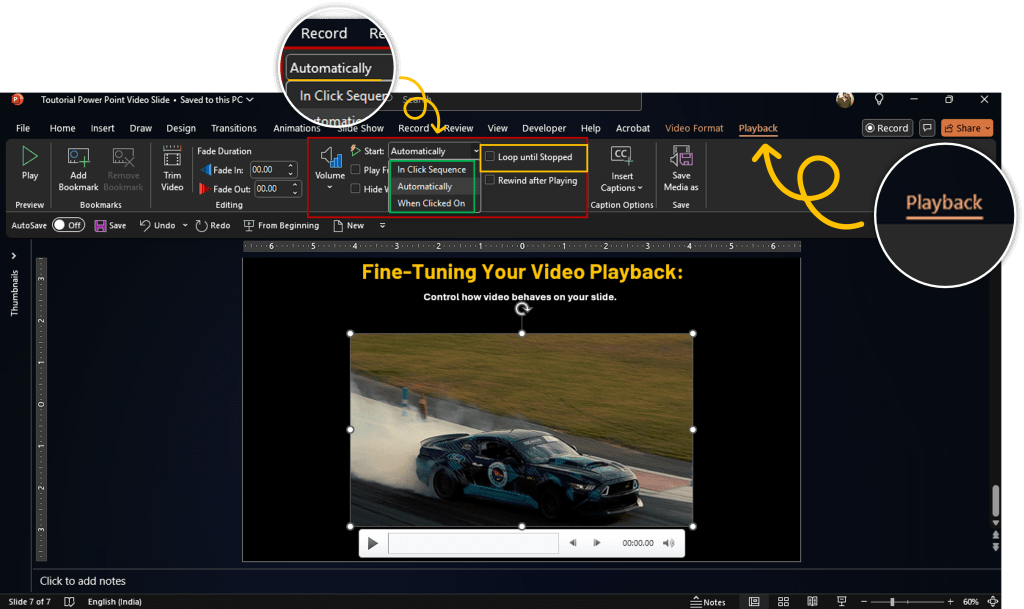
Set playback options: Should it play automatically when the slide appears? On click? Should it loop?
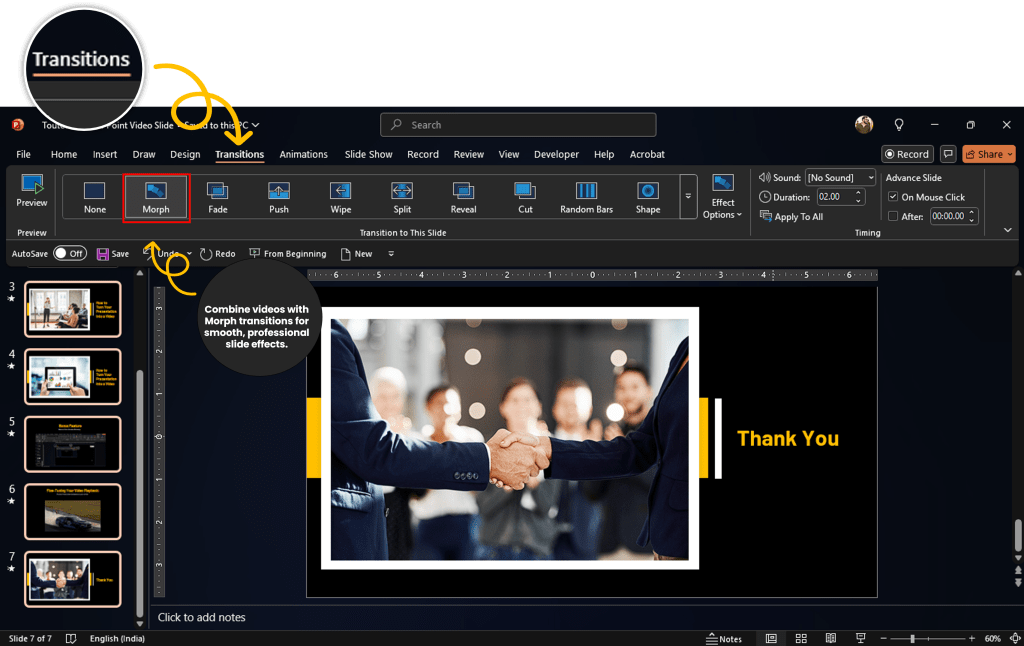
Advanced Technique: Combine inserted videos with slide transitions like Morph for incredibly smooth and professional-looking effects as elements transform or move between slides. (See more advanced animation tips here: PowerPoint animations)
Ready to Power Up Your PowerPoint Skills?
Stop settling for static, text-heavy slides.
By mastering how to effectively use PowerPoint charts, timelines, and video, you can create presentations that not only inform but also genuinely engage and persuade your audience. Give these techniques a try in your next presentation – you’ll see the difference!
With 1000+ presentations in 50+ industries, in 10+ countries, A1 Slides has helped corporates, Govts & Enterprises communicating better with impressive slides.