Beyond Visualization: PowerPoint Designers with Data Visualisation Skills
Your search is complete if you are looking for PowerPoint (PPT) experts for data visualization. Sometimes you just don’t need an average PPT designer who redesigns your presentation or puts information nicely in your PPT, but you need a solid PowerPoint designer who understands visualization like the back of their hand. In our 2000+ presentations, we found a few customers, especially banks, financial institutions, and consultants, in need of a helping hand who is a master of PowerPoint and understands data like they do.
Whether you’re pitching for funding, presenting consultation findings, or delivering critical boardroom reports, your ability to transform complex information into compelling visuals can make or break your success.
But here’s what most presentation designers won’t tell you:
“Not all data should be visualized.”
The Hidden Cost of Poor Data Presentation
For the companies we’ve rescued, the scenario was often the same. Hours spent creating charts that confusing rather than providing clarity. Executives squinting at overly complex visuals. Investment opportunities lost because the story behind the numbers wasn’t clear.
When a management consulting firm approached us after losing a big contract, their post-mortem was revealing: “We had the right analysis, but we couldn’t make them see it.”
Why 1,000+ Clients Across 50+ Industries Trust Our Data Visualization Expertise
In high-stakes presentations—funding rounds, government bids, boardroom decisions—there’s no room for visual mediocrity. Our specialized team has developed a proprietary decision framework that determines:
When data should be visualized vs. summarized vs. presented in tables
Which visualization type will most effectively communicate your specific insight
How to structure your data narrative to drive decision-making
Experienced PowerPoint Consultants who knows inside out about data visualisation
A senior investment banker at one of our BFSI clients put it best: “What used to take us days of back-and-forth with designers now happens in hours. And our close rate on pitches has improved
The Secret Framework Behind Winning Presentations
After 15+ years in PowerPoint Designing, helping companies across continents win critical approvals, we’ve developed proprietary methodologies that outperform standard PowerPoint practices:
1. The Insight-First Approach
Unlike traditional designers who start with chart types, we begin with the business insight you need to convey. Our analysis examines:
Our team uses a sophisticated decision framework to determine the optimal presentation format for each data point:
Visualization optimal: When patterns, trends, or comparisons are crucial
Summarization optimal: When executive-level takeaways are sufficient ( McKinsey Style Presentation )
Tabular presentation optimal: When precision of individual values matters most
3. The Narrative Integration System
Unlike the standalone charts most designers produce, our visualizations integrate seamlessly into your broader presentation narrative, creating a cohesive story that drives toward your desired outcome.
Real Results That Speak Volumes
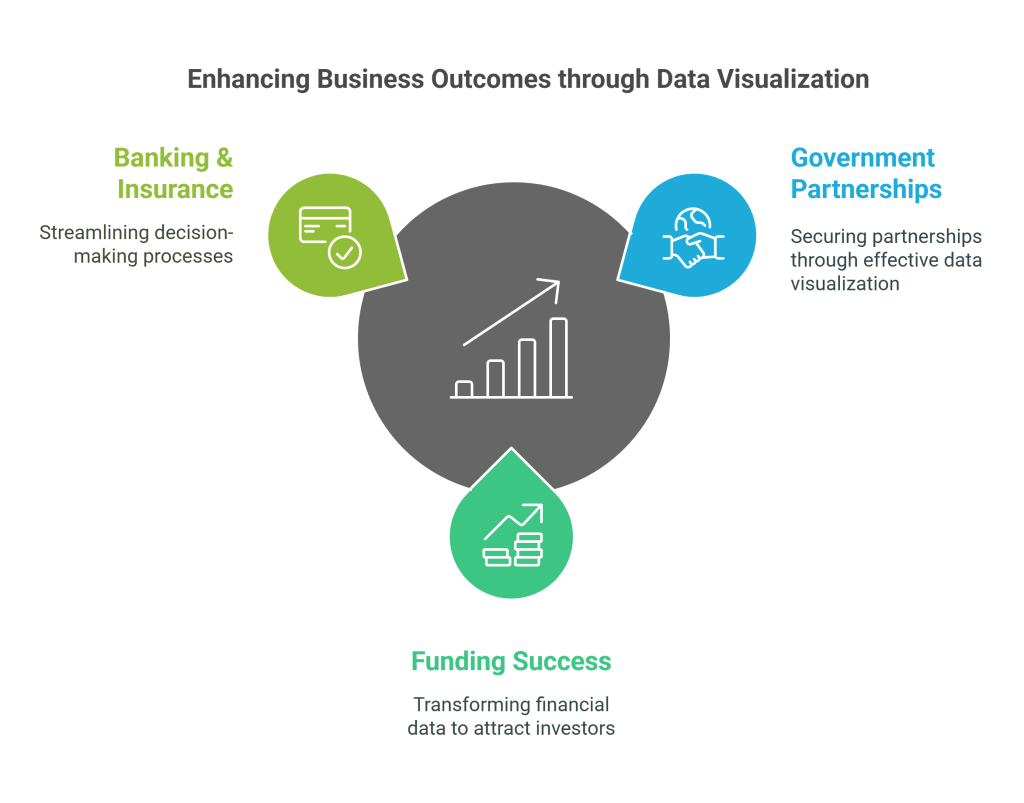
Government Partnerships: Helped a corporate client secure a coveted government partnership in Gabon through clear, compelling data visualization
Funding Success: Transformed complex financial projections into investor-friendly visuals that secured multi-million dollar investments
Banking & Insurance: Created internal presentation systems that reduced decision-making time by 40% for BFSI clients
Our Process: Expertise Delivered at Speed
We understand that in business, timing is everything. That’s why we’ve optimized our process to deliver expert results within tight timeframes:
Strategic Consultation: We begin by understanding your audience, objectives, and key insights
Data Analysis: Our specialists review your data to identify the most impactful visualization approach
Custom Design: We create tailored visualizations optimized for your specific context
Revision & Refinement: We collaborate until every element perfectly serves your objectives
Delivery & Support: Fast turnaround (48 hours standard, 24 hours for urgent needs) with implementation support
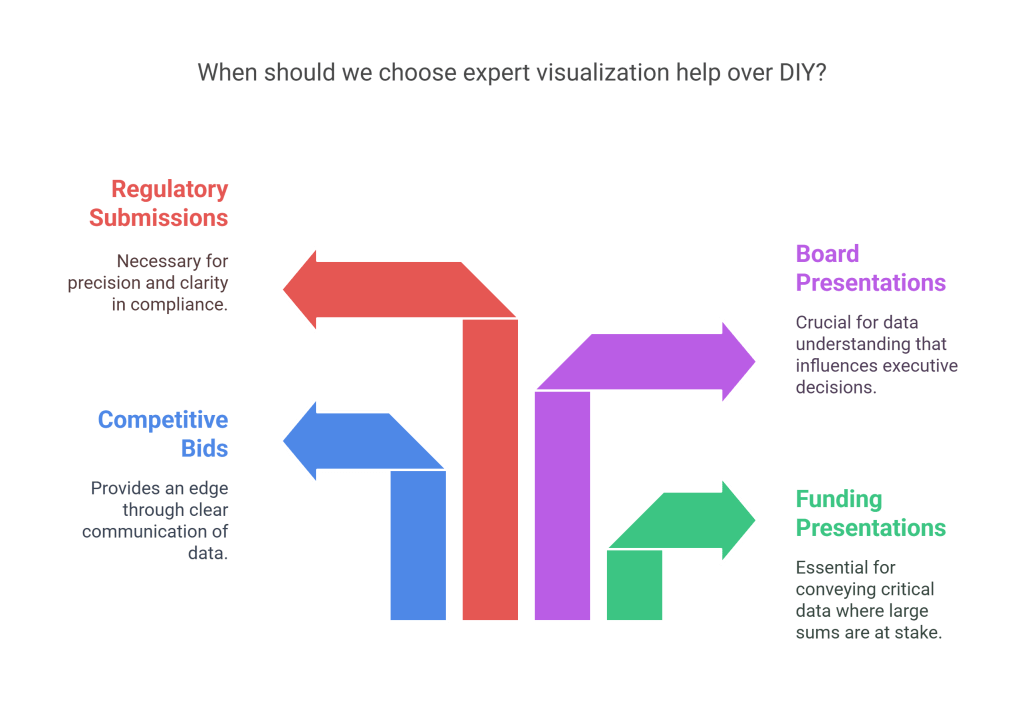
When to Choose Expert Help Over DIY Visualization
While basic charts can be created in-house, consider these scenarios where professional expertise delivers exponential returns:
High-stakes funding presentations where millions are on the line
Competitive bid situations where clear communication creates an edge
Board presentations where executive decisions hinge on data understanding
Regulatory submissions where precision and clarity are non-negotiable
Beyond the Standard Charts: Our Advanced Visualization Capabilities
Standard PowerPoint users typically rely on basic charts that often fail to capture complex relationships. Our specialized team goes beyond the basics with:
Custom-coded data visualizations not available in standard PowerPoint
Advanced animation techniques that reveal data insights sequentially
Integration of multiple data sources into unified visual narratives
Interactive elements that support real-time presentation flexibility
The Investment That Pays For Itself
Clients consistently report that our services deliver ROI through:
Higher success rates in competitive pitches and funding rounds
Faster stakeholder alignment and decision-making
Reduced internal revision cycles and presentation preparation time
Enhanced brand perception and professional credibility
Take the Next Step
When your business success depends on communicating data effectively, partner with the team trusted by 1,000+ clients across 50+ industries and 10+ countries.
Contact us today for a consultation on your specific presentation needs. With turnaround times as quick as 24 hours for urgent projects, we’re ready to transform your data into decisions.