
Mastering Visual Storytelling in Presentations
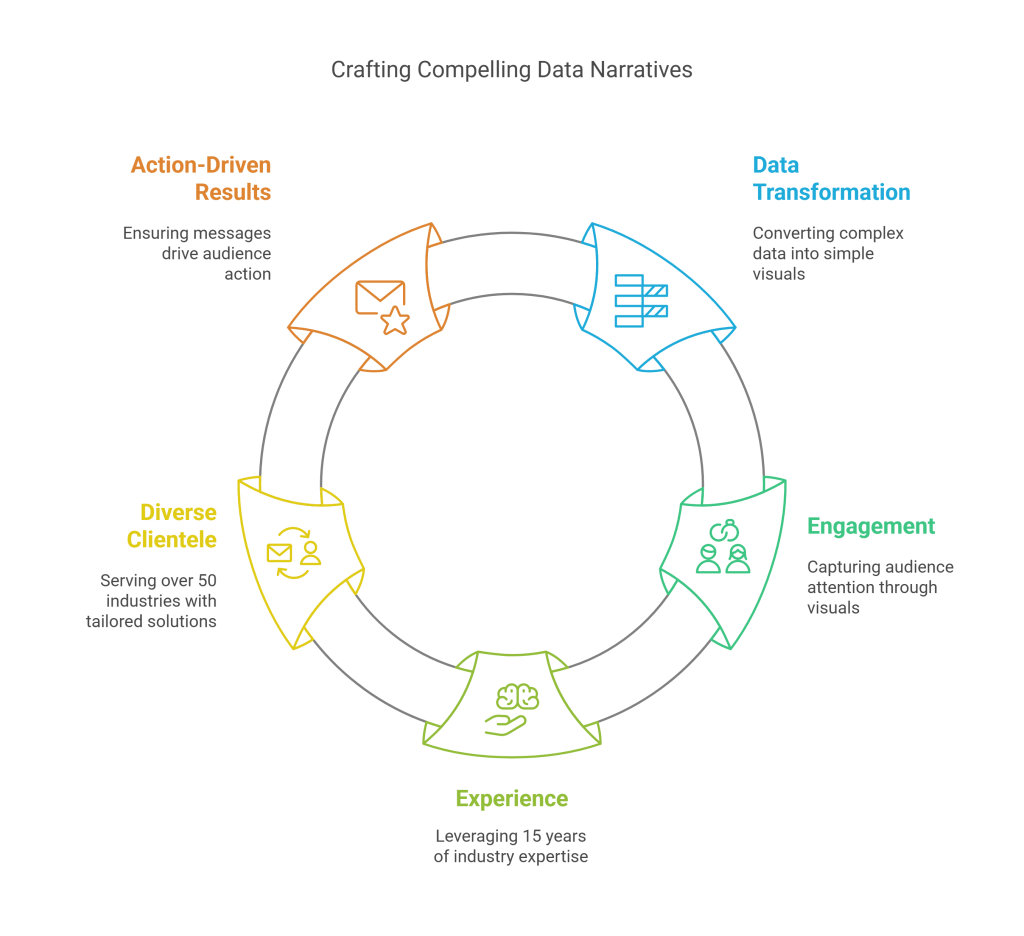
In a data-driven world, the ability to tell a compelling story with your presentation can make all the difference. Complex statistics and detailed reports can overwhelm your audience if not communicated effectively. At A1 Slides, we specialize in transforming intricate data sets into engaging, visually compelling narratives that captivate and inform. With over 15 years of experience and a diverse clientele spanning 50+ industries, we have honed the art of visual storytelling to ensure your message not only resonates but also drives action.
The Essence of Visual Storytelling
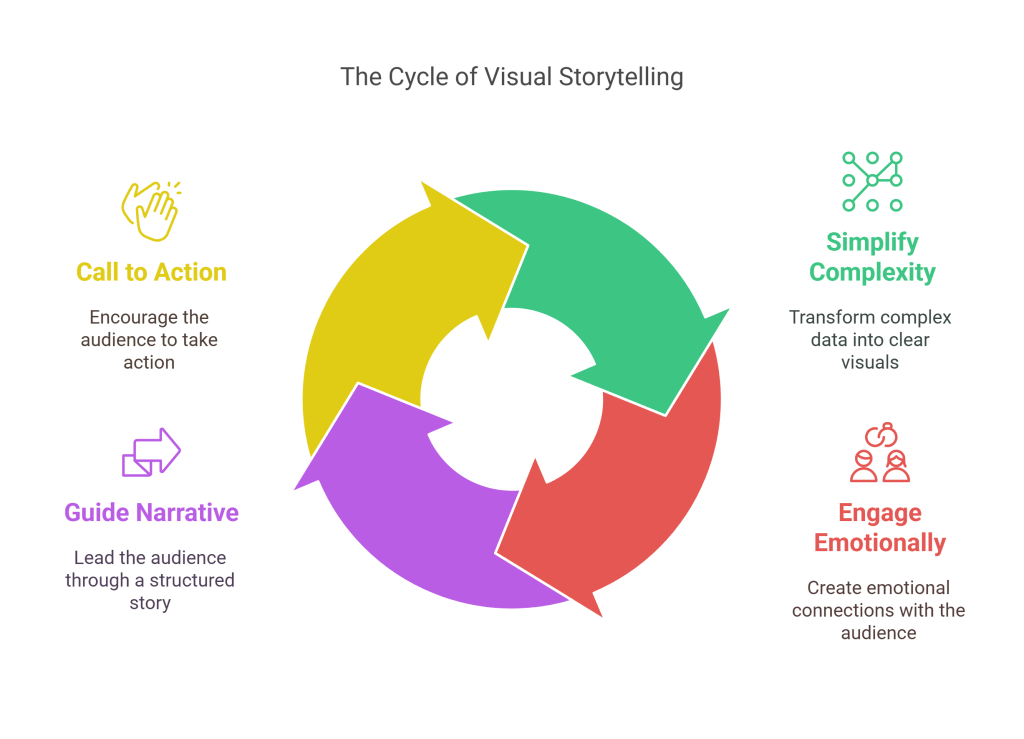
Visual storytelling is the craft of using design elements—colors, typography, imagery, and layout—to weave a narrative that supports your message. It’s about taking raw data and turning it into a story that is accessible, memorable, and impactful.
- Simplifying Complexity: The primary goal is to distill complex information into digestible visuals. Graphs, charts, and infographics can help bridge the gap between raw data and understanding.
- Emotional Engagement: A well-told story evokes emotions. When your audience connects emotionally with the content, they are more likely to remember and act upon it.
- Guiding the Narrative: Every slide should be a step in the journey, leading the audience through a clear narrative path that culminates in a strong call to action.
Why Data Needs a Story
Numbers on their own rarely tell a complete story. Consider a sales presentation: without context, data points about revenue growth can be dry and uninspiring. However, when you contextualize that data—perhaps by showing market trends or customer testimonials—the narrative becomes richer and more persuasive.
- Engagement: Stories are inherently engaging. A visual narrative can transform a monotonous data dump into an engaging experience.
- Retention: Humans are wired to remember stories more than isolated facts. A well-crafted narrative helps your audience retain the information longer.
- Persuasion: When you connect data with a compelling story, you build a persuasive argument that drives decision-making.
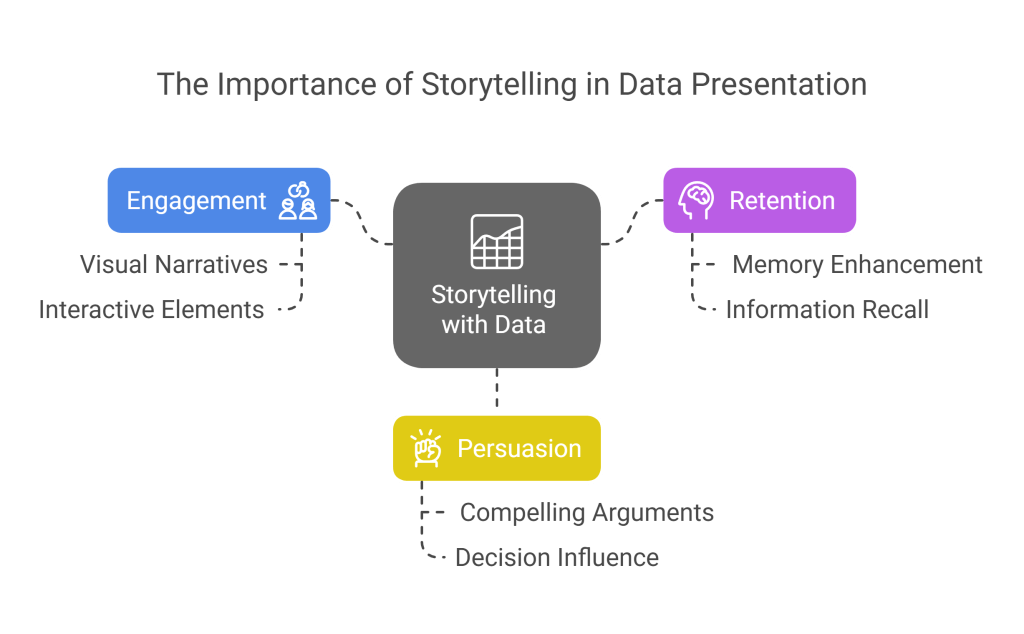
Table: Visual Storytelling Process
| Stage | Key Actions | Outcome |
|---|---|---|
| Discovery & Research | Understand data and core messaging | Identify key insights |
| Story Mapping | Define narrative structure | Cohesive, logical flow |
| Design Execution | Create visuals (charts, infographics) | Visually appealing, data-driven slides |
| Iteration | Refine based on feedback | Final design aligned with goals |
Valuable Resource
Access Our Visual Storytelling Toolkit
Download a comprehensive guide that includes templates, design tips, and best practices to transform your data into a compelling narrative. Get the Toolkit
The A1 Slides Approach
At A1 Slides, our approach to visual storytelling is rooted in a deep understanding of both design and narrative structure. Our process includes:
- Discovery & Research: We begin by immersing ourselves in your data and understanding the core message you want to convey. This stage is critical for identifying key insights and themes.
- Story Mapping: We work with you to map out the narrative flow of your presentation. This involves determining the best way to structure the data so that it tells a cohesive and compelling story.
- Design Execution: Our team of experienced designers then transforms the story map into visually appealing slides. We incorporate relevant imagery, color schemes, and design elements that enhance the narrative.
- Feedback & Iteration: Collaboration is key. We iterate on the design based on your feedback to ensure that the final product aligns perfectly with your vision.
Real-World Applications
Visual storytelling in presentations isn’t just a design trend—it’s a proven strategy that drives results. Here are some examples of how transforming data into stories has made a difference:
- Investor Pitch Decks: Startups often struggle to convey the potential of their business with numbers alone. By crafting a narrative around their data, many have successfully attracted investor attention and funding.
- Sales & Marketing Presentations: In competitive markets, a data-driven story can set you apart from the competition. Clients have reported increased conversion rates when their presentations clearly outlined customer success stories alongside sales metrics.
- Internal Reporting: For internal communications, a well-structured narrative can help align teams, highlight successes, and clarify strategic directions.

How to Identify the Need for Visual Storytelling
Ask yourself these questions:
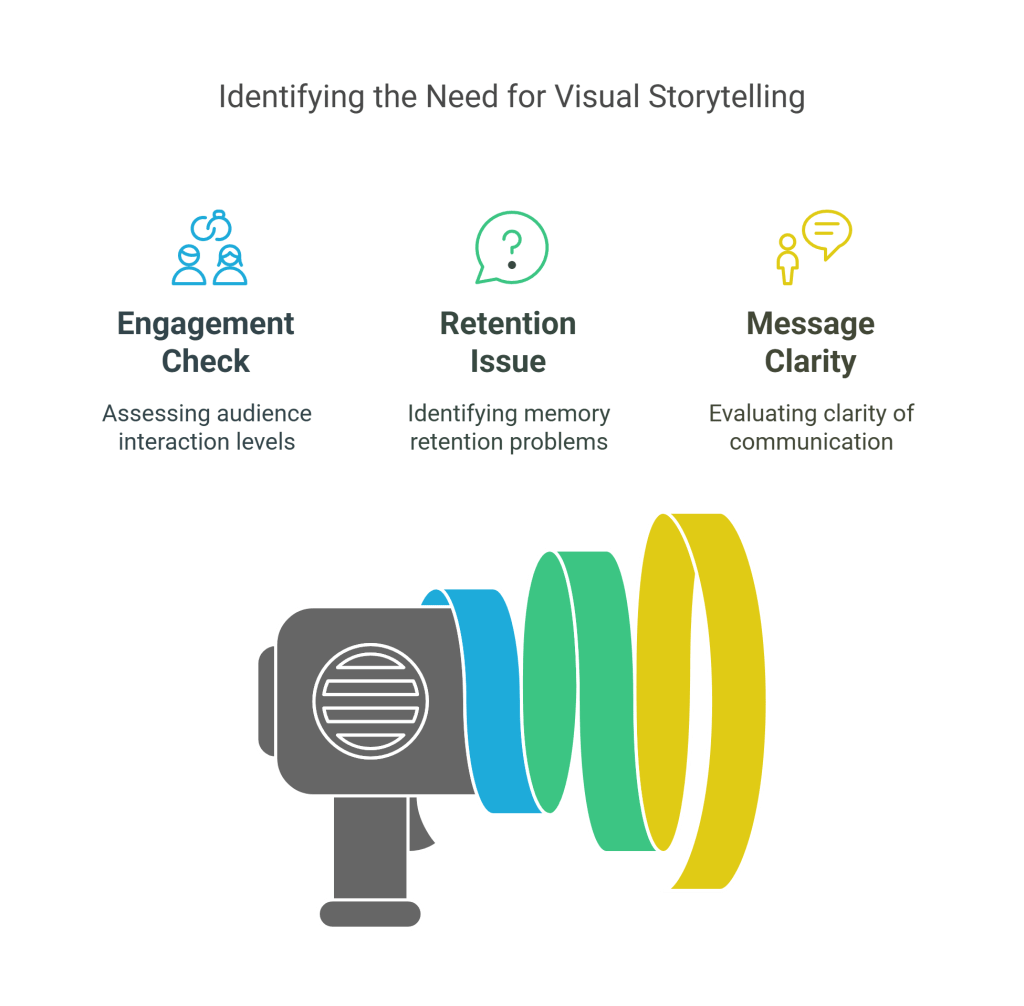
- Are your presentations filled with data but lacking in engagement?
- Do your audience members struggle to retain key points?
- Is your message being lost in a sea of numbers and charts?
If you answered “yes” to any of these, it might be time to rethink your approach and consider a strategy that emphasizes narrative and design.
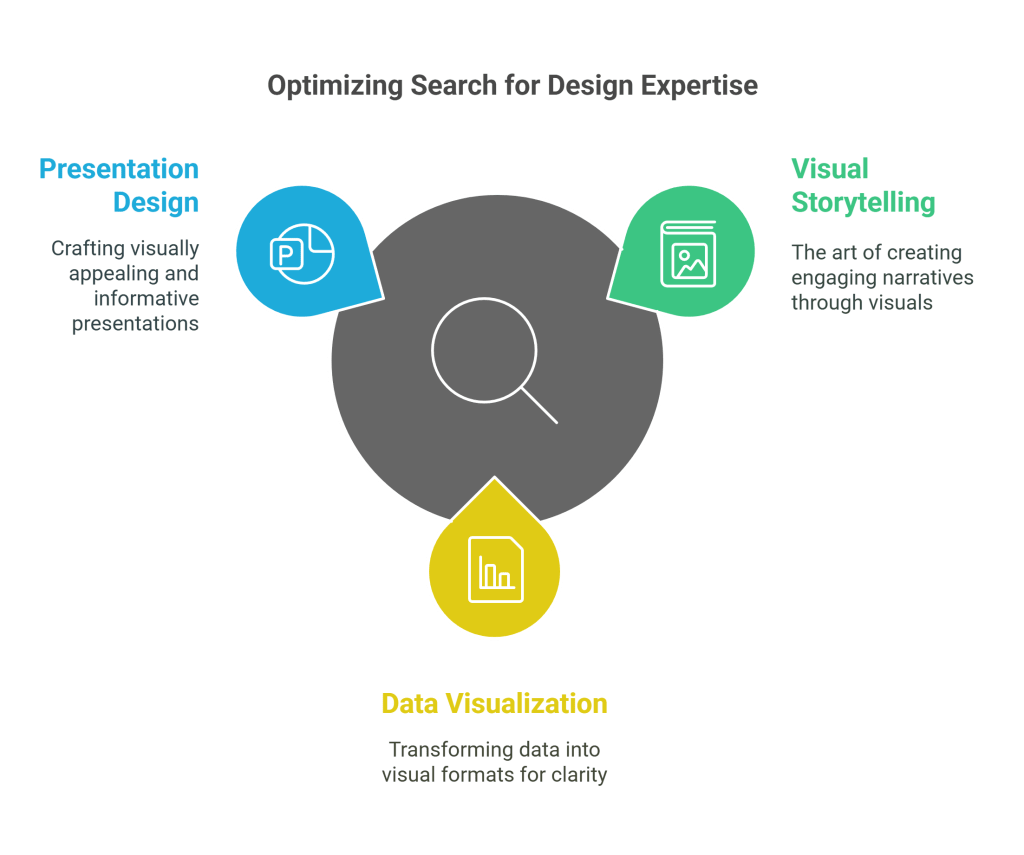
Optimizing Your Search for Expert Help
When searching online for visual storytelling and presentation design expertise, potential clients often use terms such as:
- “Visual storytelling for presentations”
- “Data visualization experts”
- “Best presentation design agency for data-driven stories”
These keywords reflect a desire to find professionals who can marry data and design in a way that communicates a compelling message.
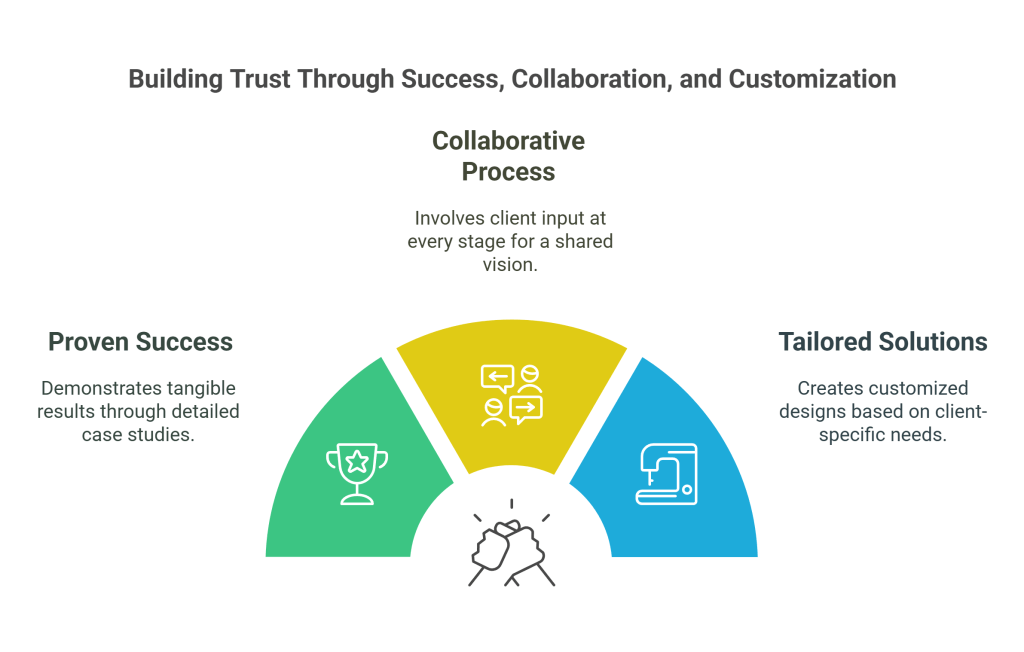
What You’ll Hear from a Trusted Partner
At A1 Slides, we believe in transparency and results. When you partner with us, here’s what you can expect:
- Proven Success: We share detailed case studies that highlight how our designs have driven tangible results for clients—from increased investor interest to boosted sales figures.
- Collaborative Process: Our workflow is highly collaborative. We value your input at every stage and ensure that the final product is a true reflection of your vision.
- Tailored Solutions: Every client is unique. We take the time to understand your industry, your audience, and your objectives to create a design that’s perfectly tailored to your needs.
Conclusion
Mastering visual storytelling in presentations is not merely an aesthetic exercise—it’s a strategic imperative. By transforming complex data into a narrative that resonates with your audience, you can elevate your message, drive engagement, and ultimately achieve your business goals.
If you’re ready to transform your presentations into powerful stories that captivate and persuade, it’s time to partner with the experts at A1 Slides. With over 15 years of experience and a track record of success with over 1000 clients worldwide, we’re here to help you turn your data into a compelling narrative that stands out in today’s competitive marketplace.
Take the first step towards mastering visual storytelling—contact us today and let’s begin the journey to creating presentations that not only inform but also inspire.
Frequently Asked Questions (FAQ)
It is the process of transforming complex data into a narrative using visuals that connect with your audience emotionally.
It makes data relatable and memorable, ensuring key points stick with your audience during critical pitches.
Yes, it helps simplify information, making it easier for teams to understand and act upon the insights.