Infographics in Presentation Design: Simplify Complex Data Visually
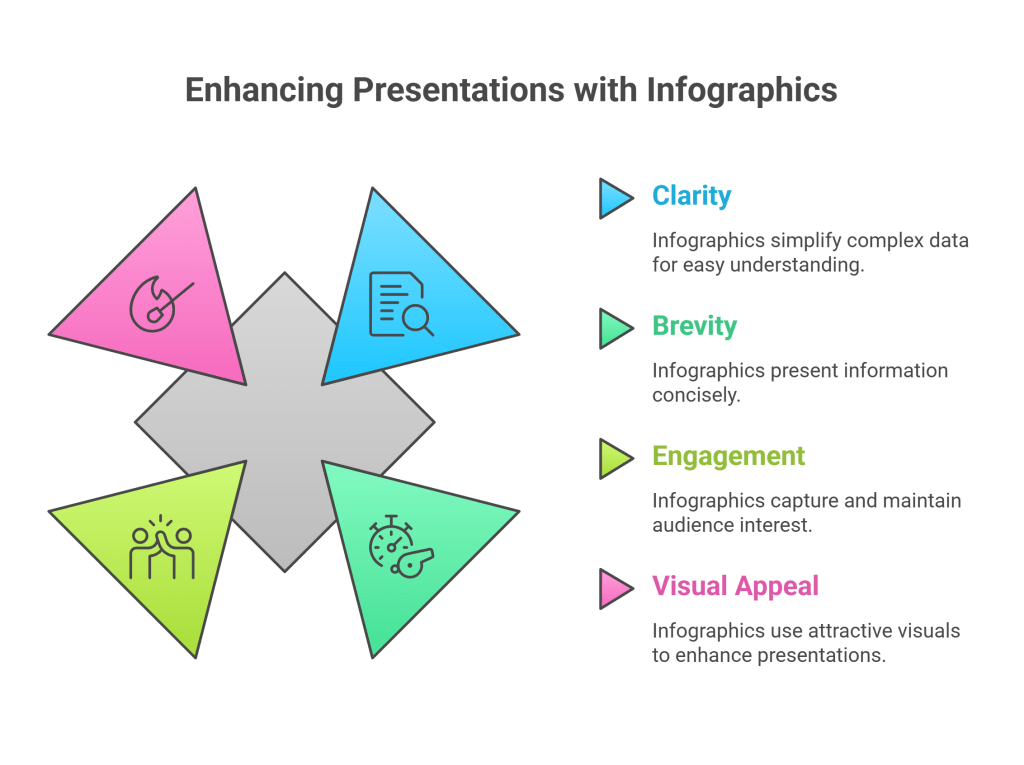
In today’s fast-paced world, audiences crave clarity and brevity. Infographics are powerful visual tools that help presenters translate complex data and ideas into easy-to-understand, engaging visuals. When used strategically, infographics can transform your presentations into memorable stories that resonate with your audience.
What Are Infographics?
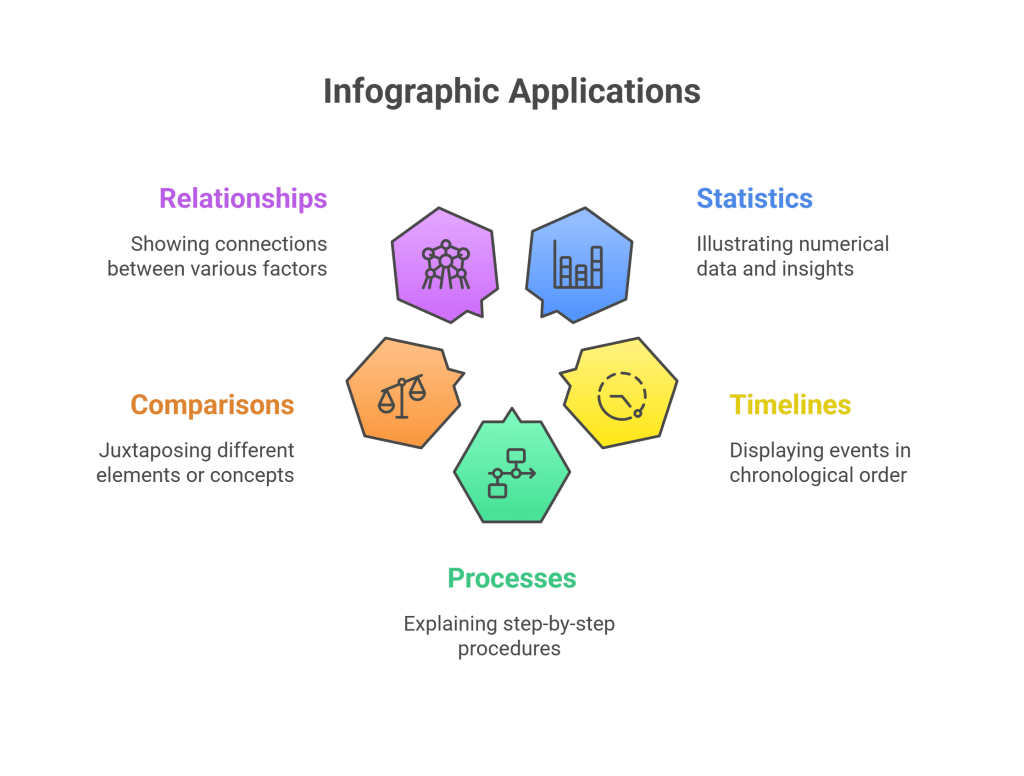
Infographics combine data, text, and visuals into a cohesive graphic that presents information clearly and concisely. They are ideal for illustrating statistics, timelines, processes, comparisons, and relationships.
Benefits of Using Infographics in Presentations
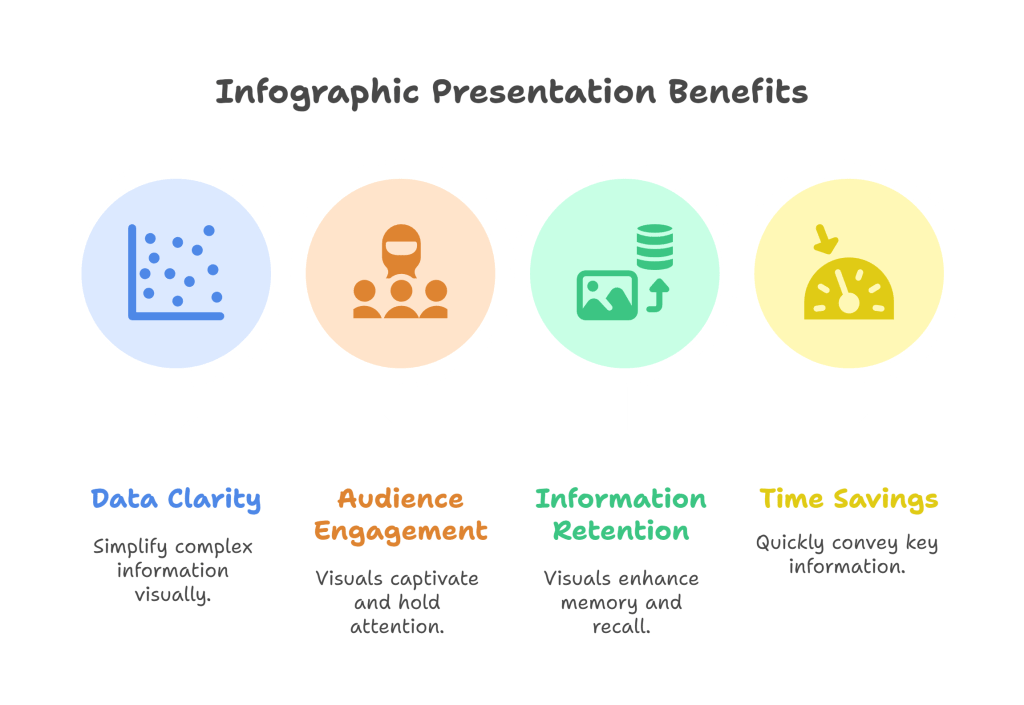
Clarify Complex Data: Break down complicated statistics into digestible visuals.
Boost Engagement: Visual storytelling keeps your audience interested and attentive.
Improve Retention: People remember images and graphics better than plain text.
Save Time: Communicate key points quickly without lengthy explanations.
Best Practices for Creating Effective Infographics
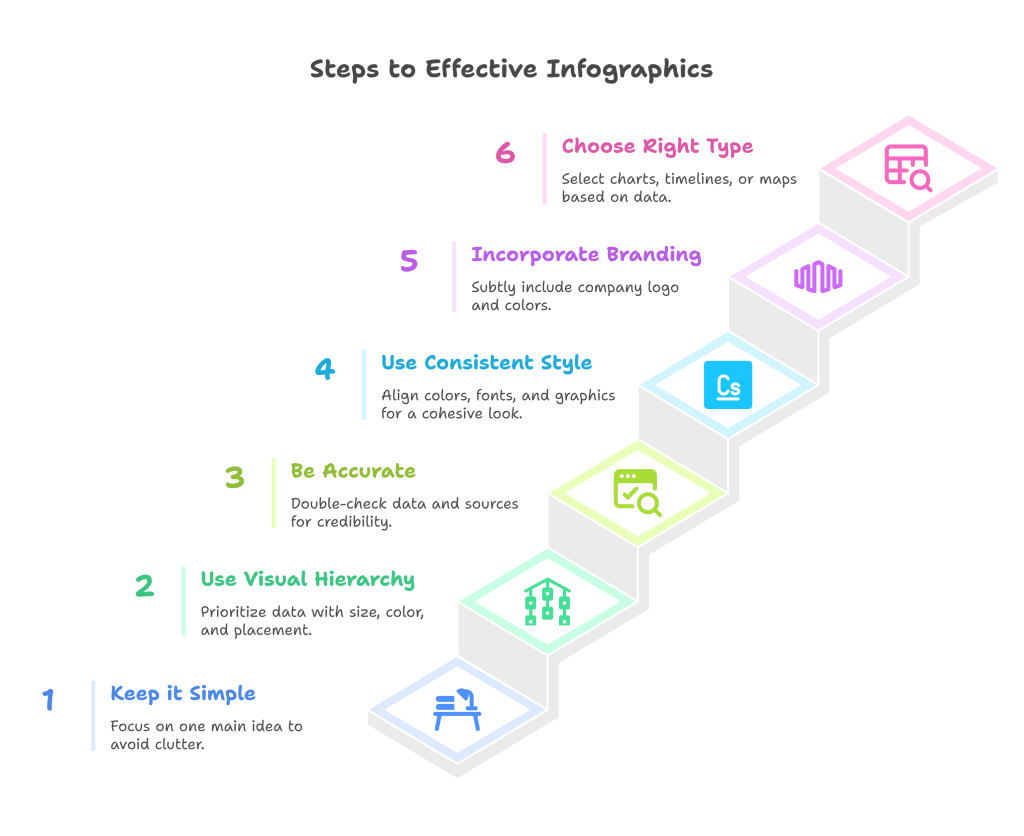
Keep it Simple: Avoid clutter; focus on one main idea per infographic.
Use Clear Visual Hierarchy: Prioritize important data with size, color, and placement.
Be Accurate: Double-check your data and sources to maintain credibility.
Incorporate Branding: Include your company logo and colors subtly for brand recognition.
Choose the Right Type: Use charts, timelines, icons, or maps depending on the data story.
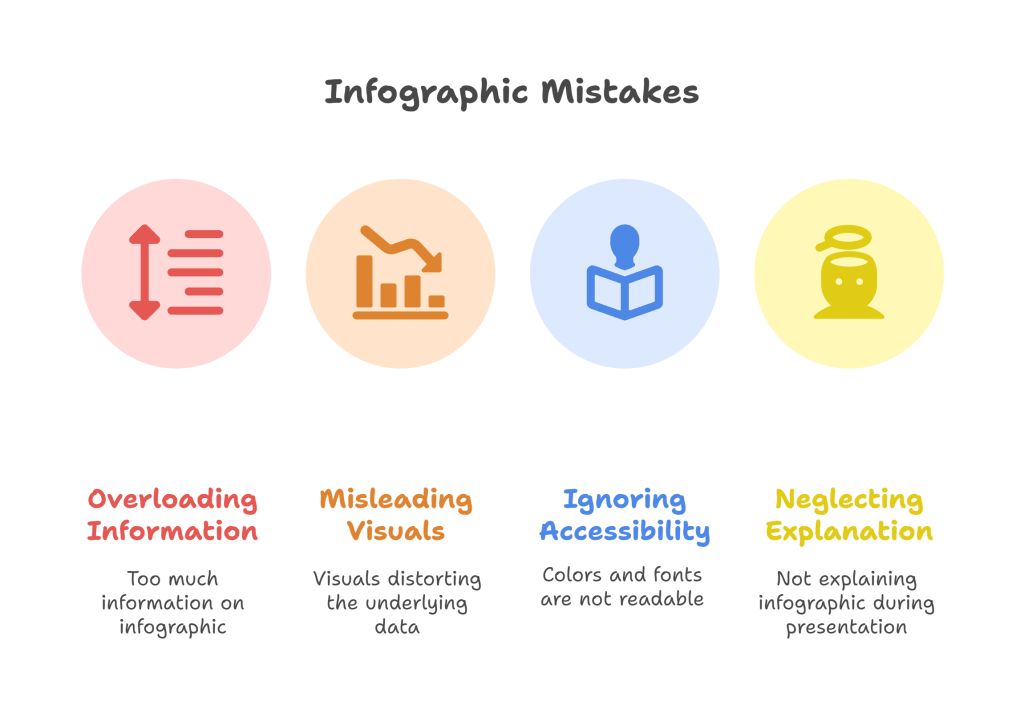
Common Mistakes to Avoid
Overloading infographics with excessive information.
Using misleading visuals that distort data.
Ignoring accessibility—ensure colors and fonts are readable.
Neglecting to explain the infographic clearly during your presentation.
Final Thoughts
Infographics are a presenter’s secret weapon to make data-driven presentations more engaging and understandable. By designing clean, purposeful infographics, you enhance your storytelling, strengthen your message, and leave a lasting impression.